

Question
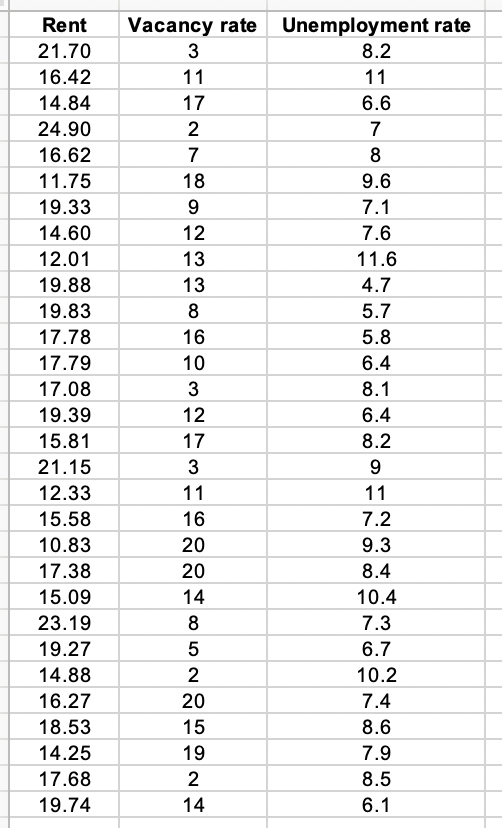
An economist wanted to investigate the relationship between office rents (the dependent variable) and vacancy rates. Accordingly, he took a random sample of monthly office
An economist wanted to investigate the relationship between office rents (the dependent variable) and vacancy rates. Accordingly, he took a random sample of monthly office rents and the percentage of vacant office space in 30 different cities.
1. Determine the regression line.
A: y^=20.64?0.3038x
B: y^=15.18?0.6773x
C: y^=20.64+0.3038x
2. What are correct interpretations for the coefficients?
A: The slope indicates that for each additional one percentage point increase in the vacancy rate rents on average decrease by b1.
B: The linear relationship existing in the range of scope of the x and y data.
C: If the coefficient b1 is near zero, it suggests there is noeffect.
3. To evaluate your coefficients, what is your SSE?
A: 221.8
B: 230.9
C: 201.3
D: 197.5
4. To evaluate your coefficients, what is your S??
A: 2.18
B: 2.87
C: 1.78
D: 1.95
5. To infer that office rents and vacancy rates are linearly related, what are the correct test statisticwe should use for Hypothesis testing :
A: Z-test
B: T-Test
C: F-Test
D: Chi-Square test
6. For above question, thevalue of the test statistic is:
A: -3.18
B: -3.87
C: -3.39
D: -3.95
7. Look at the test statistic and compare it with the threshold value:
A: There is sufficient evidence to conclude that office rents and vacancy rates are linearly related.
B: There is not sufficient evidence to conclude that office rents and vacancy rates are linearly related.
Step by Step Solution
There are 3 Steps involved in it
Step: 1

Get Instant Access to Expert-Tailored Solutions
See step-by-step solutions with expert insights and AI powered tools for academic success
Step: 2

Step: 3
Ace Your Homework with AI
Get the answers you need in no time with our AI-driven, step-by-step assistance
Get Started
Calculus (Single Variable)
Authors: Michael Sullivan
1st Edition
1464142912, 9781464142918