Answered step by step
Verified Expert Solution
Question
1 Approved Answer
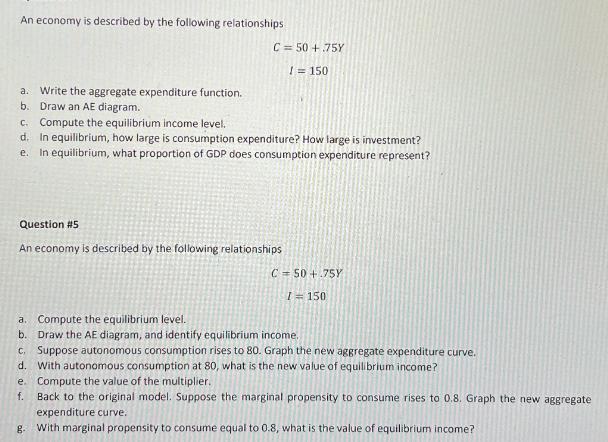
An economy is described by the following relationships a. Write the aggregate expenditure function. b. Draw an AE diagram. c. Compute the equilibrium income

An economy is described by the following relationships a. Write the aggregate expenditure function. b. Draw an AE diagram. c. Compute the equilibrium income level. C=50+.75Y / = 150 d. In equilibrium, how large is consumption expenditure? How large is investment? e. In equilibrium, what proportion of GDP does consumption expenditure represent? Question #5 An economy is described by the following relationships C 50+.75Y I 150 a. Compute the equilibrium level. b. Draw the AE diagram, and identify equilibrium income. c. Suppose autonomous consumption rises to 80. Graph the new aggregate expenditure curve. d. With autonomous consumption at 80, what is the new value of equilibrium income? e. Compute the value of the multiplier. f. Back to the original model. Suppose the marginal propensity to consume rises to 0.8. Graph the new aggregate expenditure curve. g. With marginal propensity to consume equal to 0.8, what is the value of equilibrium income?
Step by Step Solution
There are 3 Steps involved in it
Step: 1

Get Instant Access to Expert-Tailored Solutions
See step-by-step solutions with expert insights and AI powered tools for academic success
Step: 2

Step: 3

Ace Your Homework with AI
Get the answers you need in no time with our AI-driven, step-by-step assistance
Get Started


