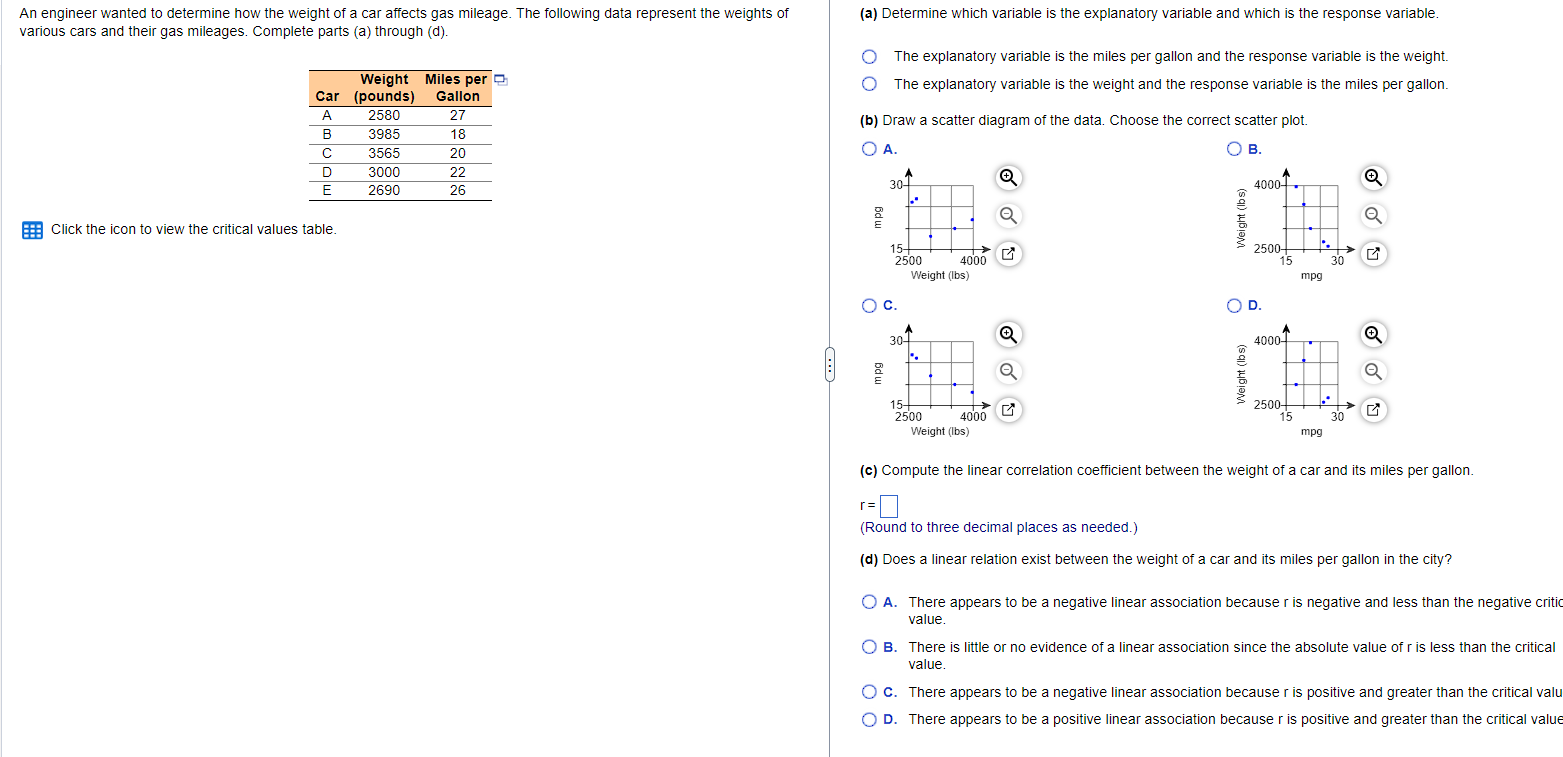
An engineer wanted to determine how the weight of a car affects gas mileage. The following data represent the weights of (a) Determine which variable
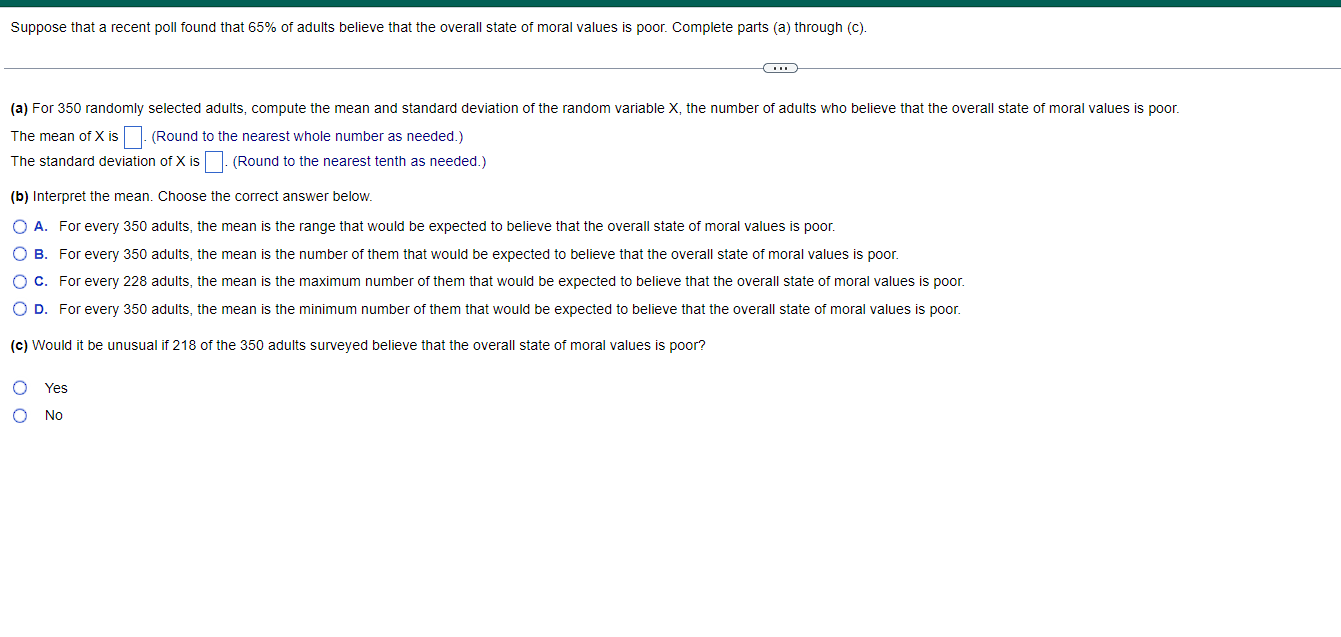
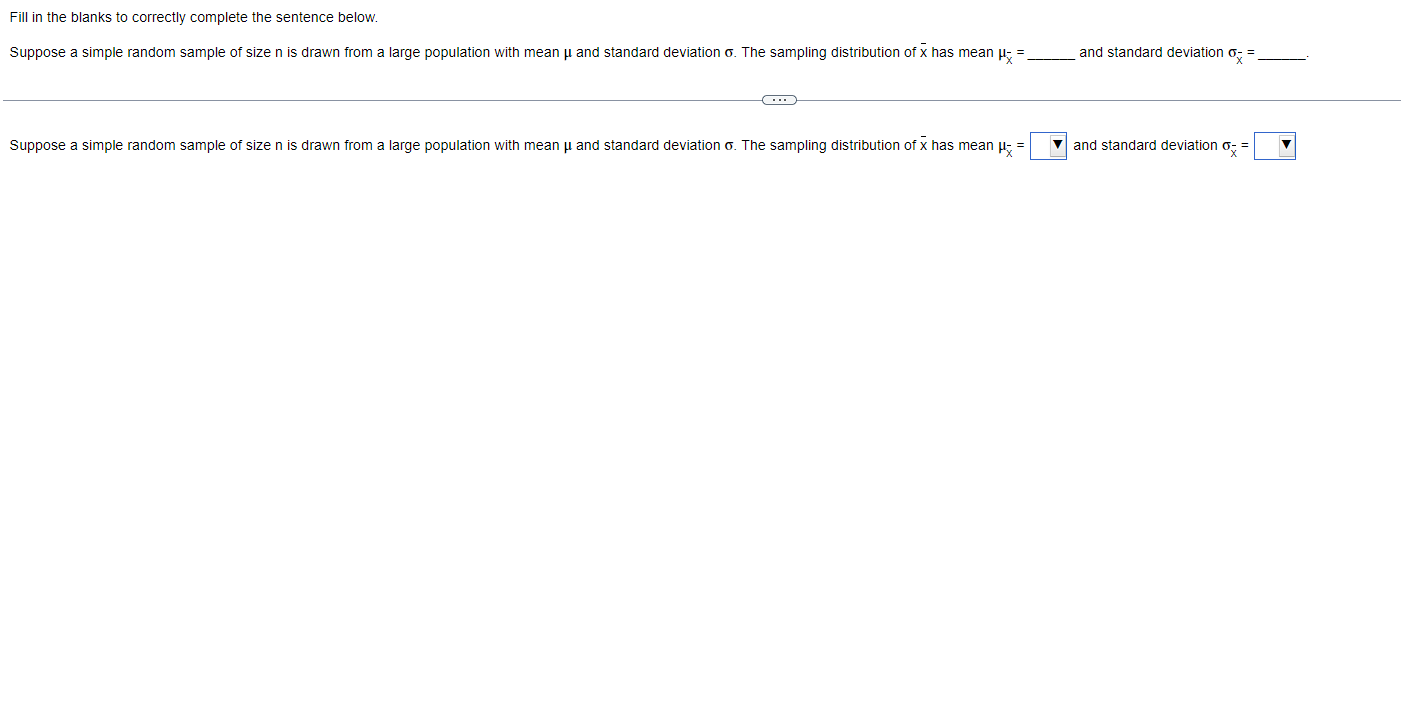
An engineer wanted to determine how the weight of a car affects gas mileage. The following data represent the weights of (a) Determine which variable is the explanatory variable and which is the response variable. various cars and their gas mileages. Complete parts (a) through (d). O The explanatory variable is the miles per gallon and the response variable is the weight. Weight Miles per O The explanatory variable is the weight and the response variable is the miles per gallon. Car (pounds) Gallon A 2580 27 (b) Draw a scatter diagram of the data. Choose the correct scatter plot. B 3985 18 C 3565 20 O A. O B. D 3000 22 E 2690 26 30- 4000-. n pg Weight (Ibs) Click the icon to view the critical values table. 15- 2500- 2500 4000 15 30 Weight (Ibs) mpg O C. O D. 30- 4000- npg Weight (Ibs) 15- 2500- 2500 4000 15 30 Weight (Ibs) mpg (c) Compute the linear correlation coefficient between the weight of a car and its miles per gallon. 1=] (Round to three decimal places as needed.) (d) Does a linear relation exist between the weight of a car and its miles per gallon in the city? O A. There appears to be a negative linear association because r is negative and less than the negative critic value. O B. There is little or no evidence of a linear association since the absolute value of r is less than the critical value. O c. There appears to be a negative linear association because r is positive and greater than the critical valu O D. There appears to be a positive linear association because r is positive and greater than the critical valueSuppose that a recent poll found that 65% of adults believe that the overall slate of moral values is poor. Complete parts (a) through (c). {a} For 350 randomly selected adults' compute the mean and standard deviation of the random variable X, the number of adults who believe that the overall state of moral values is poor. The mean of): is .{Round otne nearest whole numberas heeded) The standard deviation ofX is .{Round to the nearest tenth as needed.) (b) interpret the mean. Choose the correct answer below. Q A. For every 350 adults. the mean is the range that would be expected to believe that the overall state of moral values is poor. B. For every 350 adults, the mean is the number of them that would be expected to believe that the overall state of moral values is poor '0 C. For every 228 adults. the mean is the maximum number of them that would be expected to believe that the overall state of moral values is poor. D. For every 350 adults, the mean IS the minimum number of them that would be expected to believe that the overall state of moral values IS poor (0] Would it be unusual W216 0f the 350 adults surveyed believe that the overall state of moral values is poor? Q Yes QNo Fill in the blanks to correctly complete the sentence below. Suppose a simple random sample of size n is drawn from a large population with mean u and standard deviation o. The sampling distribution of x has mean u- = _ and standard deviation of = Suppose a simple random sample of size n is drawn from a large population with mean u and standard deviation o. The sampling distribution of x has mean ; = and standard deviation of =Test the hypothesis using the P-value approach. Be sure to verify the requirements of the test. Ho: p= 0.72 versus H1: p # 0.72 n = 500, x = 350, a = 0.05 Is no (1- Po) 2 10? Select the correct choice below and fill in the answer box to complete your choice. (Type an integer or a decimal. Do not round.) O A. No, because npo (1 - Po) = O B. Yes, because npo (1 - Po) = Now find p. p =(Type an integer or a decimal. Do not round.) Find the test statistic zo- Zo = (Round to two decimal places as needed.) Find the P-value. P-value = (Round to three decimal places as needed.) State the conclusion of the hypothesis test. because the P-value is than a.The relative frequency histogram represents the length of phone calls on George's cell phone during the month of September. Determine whether or not the histogram indicates that a normal distribution could be used as a model for the variable. 0.4 Relative Frequency 07 6 12 Length (minutes) Can a normal distribution be used as a model for the variable? O A. No, because the histogram has the shape of a normal curve. O B. Yes, because the histogram does not have the shape of a normal curve. O C. Yes, because the histogram has the shape of a normal curve. O D. No, because the histogram does not have the shape of a normal curve. O E. Yes, because the histogram is not symmetric about its mean
Step by Step Solution
There are 3 Steps involved in it
Step: 1
Get Instant Access to Expert-Tailored Solutions
See step-by-step solutions with expert insights and AI powered tools for academic success
Step: 2
Step: 3
Ace Your Homework with AI
Get the answers you need in no time with our AI-driven, step-by-step assistance