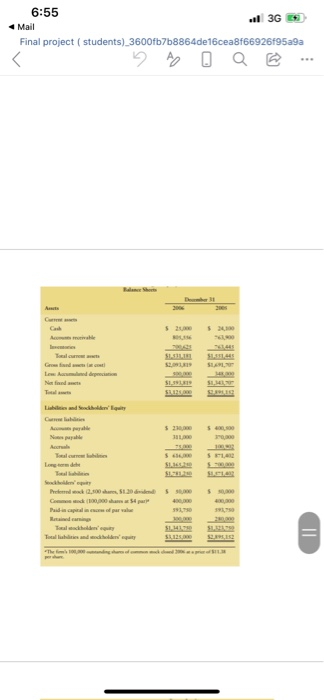
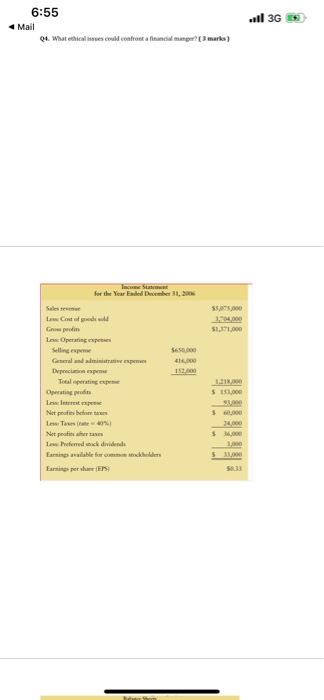
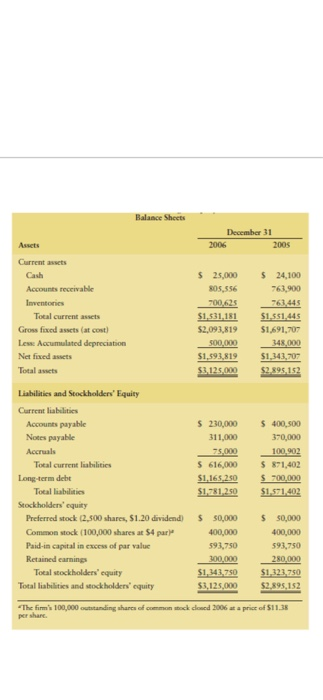
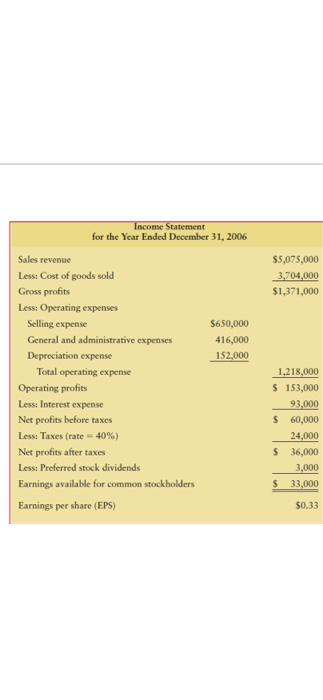
An experienced budget analyst at Technica,Inc,. , has been charged with assessing the firms financial performance during 2006 and its financial position at year-end 2006. To complete this assignment, she gathered the firms 2006 financial statements (below). In addition,
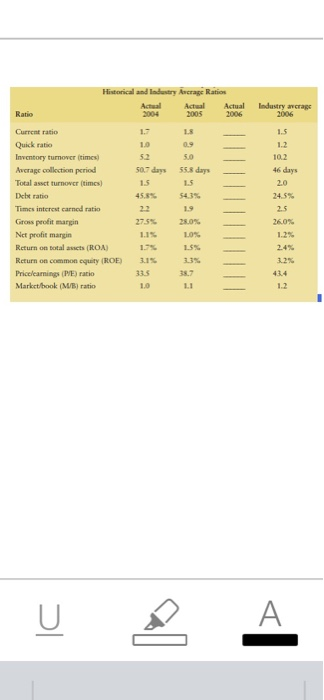
She obtained the firms ratio values for 2004 and 2005, along with the 2006 industry average ratios (also applicable to 2004 and 2005).
LG1
TO DO
Q1. Calculate the firms 2006 financial ratios, and then fill in the preceding table. (Assume a 365-day year.) (13 marks ) (1 mark each ratio listed above )
Q2. Analyze the firms current financial position from both a cross-sectional and a time-series viewpoint. Break your analysis into evaluations of the firms liquidity, activity, debt, profitability, and market. (10 marks) ( 2 marks each categories )
Q3. Summarize the firms overall financial position on the basis of your findings in part b ( 4 marks )
Q4. What ethical issues could confront a financial manger? ( 3 marks )
6:55 l 3G Mail Final project ( students) 3600fb7b8864de16cea8f66926F95a9a Case $ 22. SU La desain S1 3117 Pred weak 2,500, 51.29 de 5 Pencapai SH SRECE ..1 3G 6:55 Mail Q4. What ethical issues could confronta financial manger? [3 marks) Income Star for the Year Ended December 31, 2006 55.075.000 3,704,000 $1,371.000 Low Cost of goods old Gross profits Lew: Operating Sellingen General and ministrative experts Depreciation expen Total operating expense 5650,000 416,000 1.218.000 $ 15,000 Lew Intertex Net profits before Les Tesesire 30%) Net profitabertas Les Preferred ac dividende Earnings wailable for common stockholders Farning per share (EPS $ 60,000 34000 $5,000 1,000 $ 33,000 6:55 Mail . 3G I U Hello QWERT ASD F G H J K L Z X C v BNM 123 space return GA Balance Sheets December 31 2006 2005 Assets Current as Cash $ 25,000 $ 24,100 Accounts receivable 805,556 763,900 Inventories 700,625 763,445 Total current sets $1,531,181 $1,551.445 Gross fixed assets (at cost) $2,093,819 $1,691,707 Less Accumulated depreciation 500,000 348,000 Net fixed $1,593,819 $1,343,707 Total acts $2.125.000 $2.895.152 Liabilities and Stockholders' Equity Current liabilities Accounts payable $ 230,000 5400, 500 Notes payable 311,000 370,000 Accruals 75.000 100,902 Total current liabilities $ 616,000 $ 871,402 Long-term debe $1,165 2.50 $ 700,000 Total liabilities $1.781,250 $1,571,402 Stockholders' equity Preferred stock (2,500 shares, $1.20 dividend) $ 50,000 $ 50,000 Common stock (100,000 shares at 54 par 400,000 400,000 Paid-in capital in excess of par value 593,750 593,750 Retained earning 300,000 280,000 Total stockholders' equity $1,343,750 $1.323.750 Total liabilities and sockholders' equity $3,125,000 $2.895,152 "The firm's 100,000 outstanding shares of common stock doned 2006 at a price of $11.38 per share Income Statement for the Year Ended December 31, 2006 $5,075,000 3,704,000 $1,371,000 $650,000 416,000 152.000 Sales revenue Less: Cost of goods sold Gross profits Less: Operating expenses Selling expense General and administrative expenses Depreciation expense Total operating expense Operating profits Less: Interest expense Net profits before taxes Less: Taxes (rate=40%) Net profits after taxes Less: Preferred stock dividends Earnings available for common stockholders Earnings per share (EPS) 1,218,000 $ 153,000 93,000 $ 60,000 24,000 $ 36,000 3,000 $ 33,000 $0.33 Historical and Industry Rucrage Ratione Ratio Actual 2004 Actual 2005 Actual 2006 Industry ancrage 2006 LS 5.0 1.7 10 52 50.7 days 1.5 45.8% 1.5 1.2 10.2 46 days 2.0 558 days 1.5 Current ratio Quick ratio Inventory turnover times) Average collection period Total aset turnover (times) Debe ratio Times interest carned ratio Gross profit margin Net profit margin Return on total acts (ROA) Return on common cquity (ROE) Pricelearnings (PE) ratio Market/book(M/) ratio 2.5 26.0% 27.55 1.9 31% 335 1.0 19 28.0% 10% LS 13% 37 LI 2.4% 32% 43.4 1.2 U A 6:55 l 3G Mail Final project ( students) 3600fb7b8864de16cea8f66926F95a9a Case $ 22. SU La desain S1 3117 Pred weak 2,500, 51.29 de 5 Pencapai SH SRECE ..1 3G 6:55 Mail Q4. What ethical issues could confronta financial manger? [3 marks) Income Star for the Year Ended December 31, 2006 55.075.000 3,704,000 $1,371.000 Low Cost of goods old Gross profits Lew: Operating Sellingen General and ministrative experts Depreciation expen Total operating expense 5650,000 416,000 1.218.000 $ 15,000 Lew Intertex Net profits before Les Tesesire 30%) Net profitabertas Les Preferred ac dividende Earnings wailable for common stockholders Farning per share (EPS $ 60,000 34000 $5,000 1,000 $ 33,000 6:55 Mail . 3G I U Hello QWERT ASD F G H J K L Z X C v BNM 123 space return GA Balance Sheets December 31 2006 2005 Assets Current as Cash $ 25,000 $ 24,100 Accounts receivable 805,556 763,900 Inventories 700,625 763,445 Total current sets $1,531,181 $1,551.445 Gross fixed assets (at cost) $2,093,819 $1,691,707 Less Accumulated depreciation 500,000 348,000 Net fixed $1,593,819 $1,343,707 Total acts $2.125.000 $2.895.152 Liabilities and Stockholders' Equity Current liabilities Accounts payable $ 230,000 5400, 500 Notes payable 311,000 370,000 Accruals 75.000 100,902 Total current liabilities $ 616,000 $ 871,402 Long-term debe $1,165 2.50 $ 700,000 Total liabilities $1.781,250 $1,571,402 Stockholders' equity Preferred stock (2,500 shares, $1.20 dividend) $ 50,000 $ 50,000 Common stock (100,000 shares at 54 par 400,000 400,000 Paid-in capital in excess of par value 593,750 593,750 Retained earning 300,000 280,000 Total stockholders' equity $1,343,750 $1.323.750 Total liabilities and sockholders' equity $3,125,000 $2.895,152 "The firm's 100,000 outstanding shares of common stock doned 2006 at a price of $11.38 per share Income Statement for the Year Ended December 31, 2006 $5,075,000 3,704,000 $1,371,000 $650,000 416,000 152.000 Sales revenue Less: Cost of goods sold Gross profits Less: Operating expenses Selling expense General and administrative expenses Depreciation expense Total operating expense Operating profits Less: Interest expense Net profits before taxes Less: Taxes (rate=40%) Net profits after taxes Less: Preferred stock dividends Earnings available for common stockholders Earnings per share (EPS) 1,218,000 $ 153,000 93,000 $ 60,000 24,000 $ 36,000 3,000 $ 33,000 $0.33 Historical and Industry Rucrage Ratione Ratio Actual 2004 Actual 2005 Actual 2006 Industry ancrage 2006 LS 5.0 1.7 10 52 50.7 days 1.5 45.8% 1.5 1.2 10.2 46 days 2.0 558 days 1.5 Current ratio Quick ratio Inventory turnover times) Average collection period Total aset turnover (times) Debe ratio Times interest carned ratio Gross profit margin Net profit margin Return on total acts (ROA) Return on common cquity (ROE) Pricelearnings (PE) ratio Market/book(M/) ratio 2.5 26.0% 27.55 1.9 31% 335 1.0 19 28.0% 10% LS 13% 37 LI 2.4% 32% 43.4 1.2 U A
