

Question
An experiment was conducted to compare the alcohol content of soy sauce on two different production lines. production line 1: 0.48 0.39 0.42 0.52 0.40
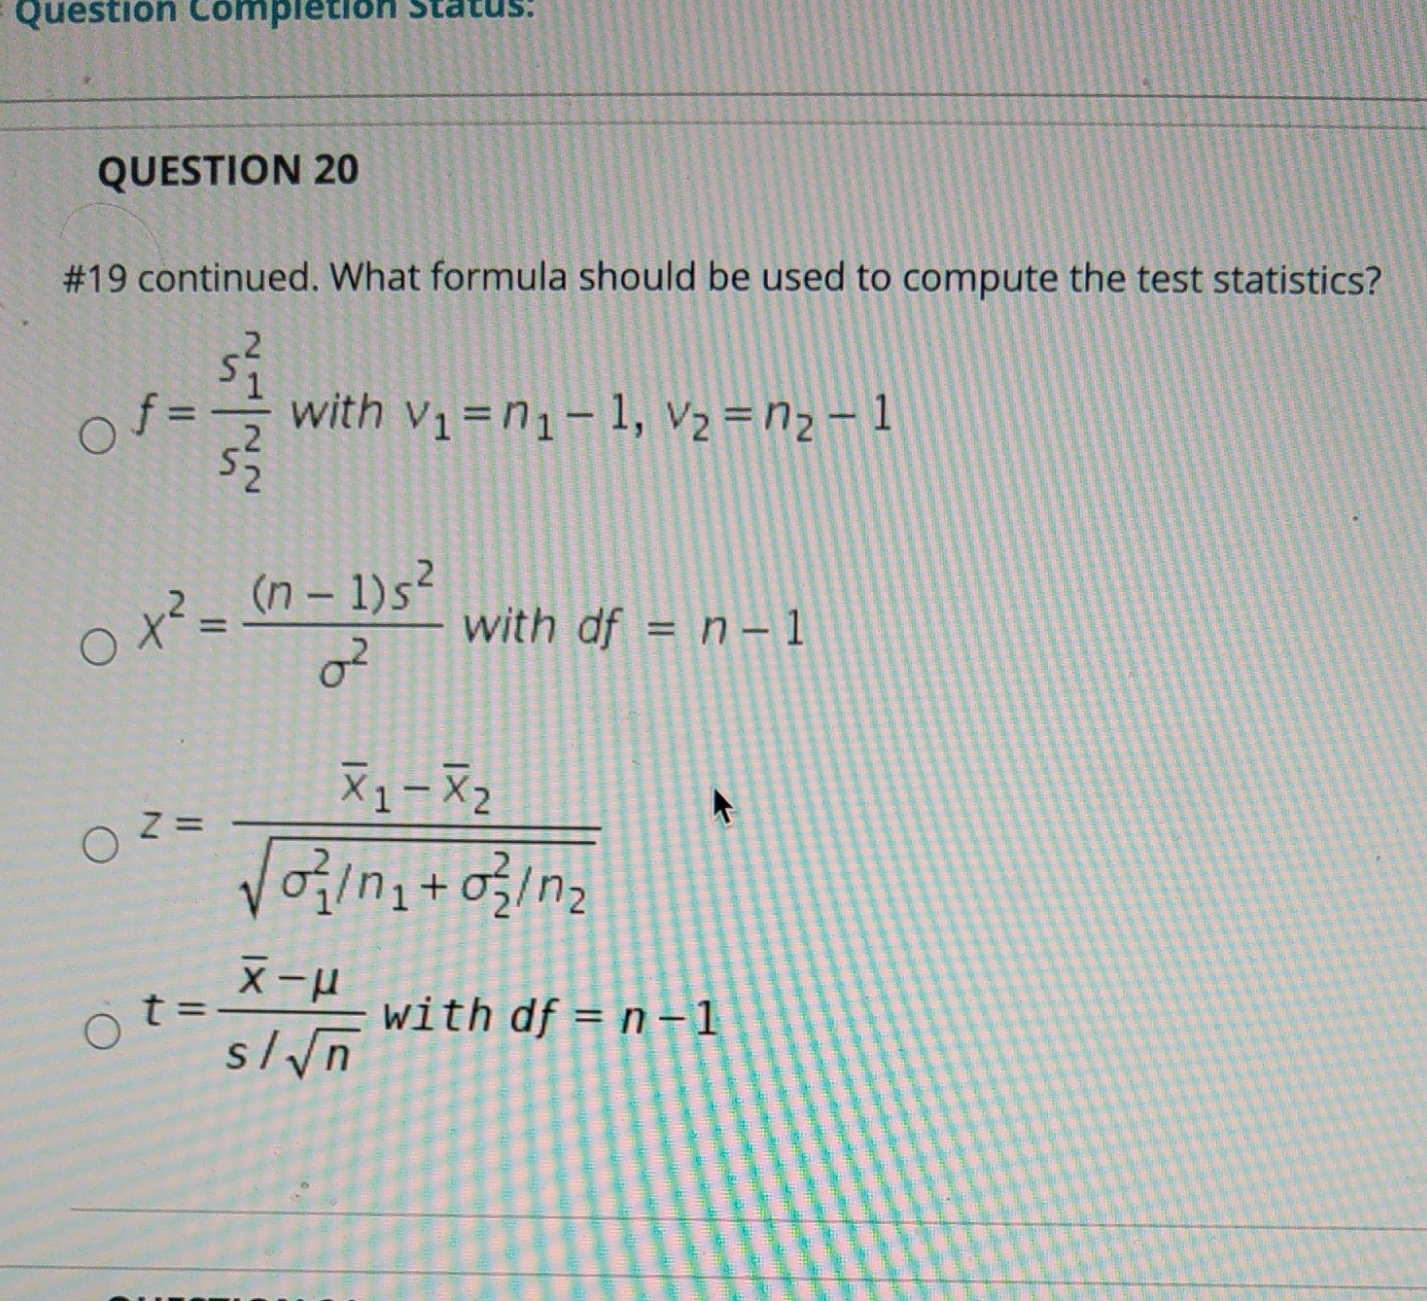
An experiment was conducted to compare the alcohol content of soy sauce on two different production lines. production line 1: 0.48 0.39 0.42 0.52 0.40 0.48 0.52 0.52 Production line 2: 0.38 0.37 0.39 0.41 0.38 0.39 0.40 0.39 Assume both populations are normally distributed. The researcher suspects that the two production lines result in different consistencies( different variances) in terms of alcohol content. he wants to perform a test using level of significance = 0.03. A) Set up the hypotheses. Use subscript 1 for line 1 and 2 for line 2. B) What formula should be used to compute the test statistics? C) Compute the test statistic and the p-value. D) at the level of significance = 0.03, what are the decisions regarding the null and alternative hypotheses? E) What is the conclusion in real life language? F) What type of error could have been made?
Step by Step Solution
There are 3 Steps involved in it
Step: 1

Get Instant Access to Expert-Tailored Solutions
See step-by-step solutions with expert insights and AI powered tools for academic success
Step: 2

Step: 3
Ace Your Homework with AI
Get the answers you need in no time with our AI-driven, step-by-step assistance
Get Started
Theory And Applications Of Partial Functional Differential Equations
Authors: Abrar A Khan
1st Edition
9353141915, 9789353141912