Question
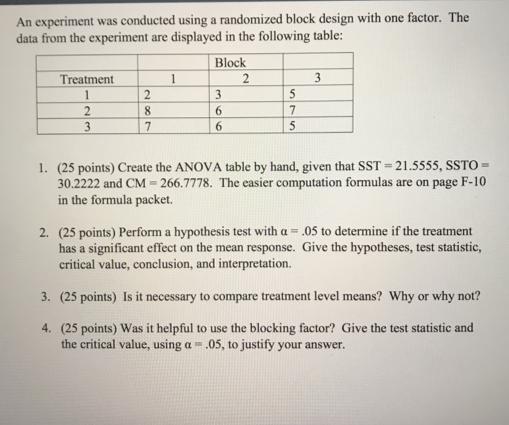
An experiment was conducted using a randomized block design with one factor. The data from the experiment are displayed in the following table: Treatment

An experiment was conducted using a randomized block design with one factor. The data from the experiment are displayed in the following table: Treatment 1 2 3 2 8 7 1 Block 3 6 6 2 575 3 1. (25 points) Create the ANOVA table by hand, given that SST-21.5555, SSTO= 30.2222 and CM = 266.7778. The easier computation formulas are on page F-10 in the formula packet. 2. (25 points) Perform a hypothesis test with a = .05 to determine if the treatment has a significant effect on the mean response. Give the hypotheses, test statistic, critical value, conclusion, and interpretation. 3. (25 points) Is it necessary to compare treatment level means? Why or why not? 4. (25 points) Was it helpful to use the blocking factor? Give the test statistic and the critical value, using a = .05, to justify your answer.
Step by Step Solution
3.59 Rating (160 Votes )
There are 3 Steps involved in it
Step: 1

Get Instant Access to Expert-Tailored Solutions
See step-by-step solutions with expert insights and AI powered tools for academic success
Step: 2

Step: 3

Ace Your Homework with AI
Get the answers you need in no time with our AI-driven, step-by-step assistance
Get StartedRecommended Textbook for
Statistics For Business And Economics
Authors: James T. McClave, P. George Benson, Terry T Sincich
12th Edition
032182623X, 978-0134189888, 134189884, 978-0321826237
Students also viewed these Accounting questions
Question
Answered: 1 week ago
Question
Answered: 1 week ago
Question
Answered: 1 week ago
Question
Answered: 1 week ago
Question
Answered: 1 week ago
Question
Answered: 1 week ago
Question
Answered: 1 week ago
Question
Answered: 1 week ago
Question
Answered: 1 week ago
Question
Answered: 1 week ago
Question
Answered: 1 week ago
Question
Answered: 1 week ago
Question
Answered: 1 week ago
Question
Answered: 1 week ago
Question
Answered: 1 week ago
Question
Answered: 1 week ago
Question
Answered: 1 week ago
Question
Answered: 1 week ago
Question
Answered: 1 week ago
Question
Answered: 1 week ago
Question
Answered: 1 week ago
Question
Answered: 1 week ago
View Answer in SolutionInn App


