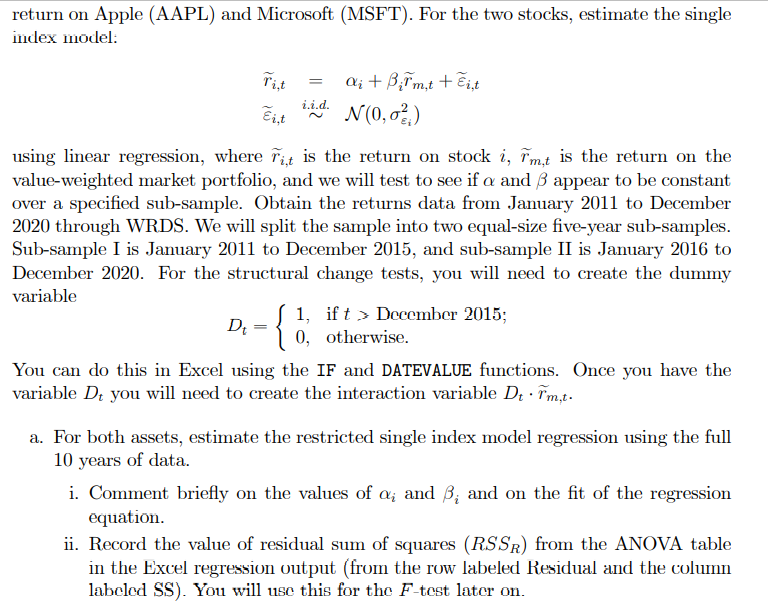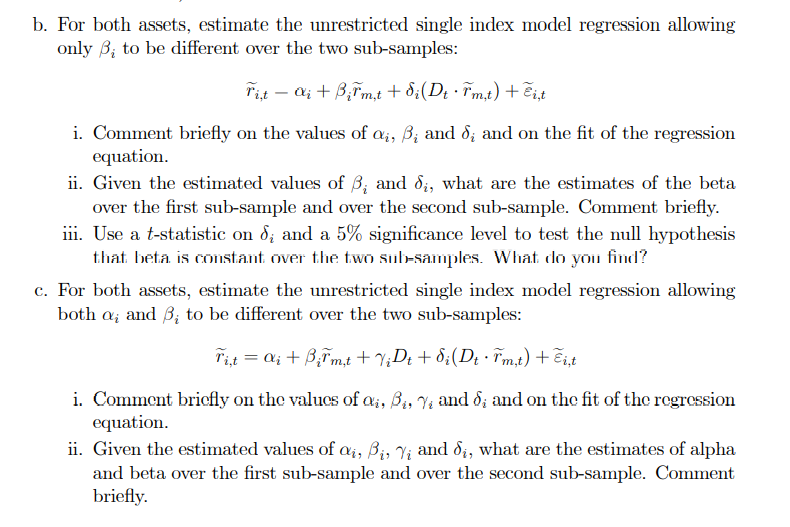


An important maintained assumption of much empirical work in the CAPM framework is that the B parameter is stable over time. To the extent that companies within the same industry are relatively similar, one might also expect that the Bs are equal across companies in the same industry. In this exercise, such assumption is tested using monthly return on Apple (AAPL) and Microsoft (MSFT). For the two stocks, estimate the single index model: = Q; + Bifm,t + Eint i.i.d. Eit N(0,0%) using linear regression, where rat is the return on stock i, im,t is the return on the value-weighted market portfolio, and we will test to see if a and B appear to be constant over a specified sub-sample. Obtain the returns data from January 2011 to December 2020 through WRDS. We will split the sample into two equal-size five-year sub-samples. Sub-sample I is January 2011 to December 2015, and sub-sample II is January 2016 to December 2020. For the structural change tests, you will need to create the dummy variable D { 1, otherwisember 2015; 0, You can do this in Excel using the IF and DATEVALUE functions. Once you have the variable Dt you will need to create the interaction variable Dr. Pm,t- a. For both assets, estimate the restricted single index model regression using the full 10 years of data. i. Comment briefly on the values of a; and B; and on the fit of the regression equation. ii. Record the value of residual sum of squares (RSSR) from the ANOVA table in the Excel regression output (from the row labeled Residual and the column labeled SS). You will use this for the F-test later on. b. For both assets, estimate the unrestricted single index model regression allowing only B; to be different over the two sub-samples: rint Q; + BPm,t + 8;(Dz. Pm,t) + @i,t i. Comment briefly on the values of ai, B; and 8; and on the fit of the regression equation. ii. Given the estimated values of B; and di, what are the estimates of the beta over the first sub-sample and over the second sub-sample. Comment briefly. iii. Use a t-statistic on d; and a 5% significance level to test the null hypothesis that beta is constant over the two sub-samples. What do you find? c. For both assets, estimate the unrestricted single index model regression allowing both a; and B; to be different over the two sub-samples: Tant = ; + Bim,t +7;D+ +8;(Dz. im,t) + Eint i. Comment briefly on the values of ai, Bi, Y. and 8; and on the fit of the regression equation. ii. Given the estimated values of ai, Big Vi and di, what are the estimates of alpha and beta over the first sub-sample and over the second sub-sample. Comment briefly. iii. Using individual t-statistics on Y; and d; and a 5% significance level to test the null hypotheses that alpha is constant is constant over the two sub-samples and beta is constant over the two sub-samples. What do you find? iv. Record the value of residual sum of squares (RSSUR) from the ANOVA table in the Excel regression output (from the row labeled Residual and the column labeled SS). Use an F-statistic and a 5% significance level to test the hypothesis that both alpha and beta are the same over both sub-samples. What do you find? An important maintained assumption of much empirical work in the CAPM framework is that the B parameter is stable over time. To the extent that companies within the same industry are relatively similar, one might also expect that the Bs are equal across companies in the same industry. In this exercise, such assumption is tested using monthly return on Apple (AAPL) and Microsoft (MSFT). For the two stocks, estimate the single index model: = Q; + Bifm,t + Eint i.i.d. Eit N(0,0%) using linear regression, where rat is the return on stock i, im,t is the return on the value-weighted market portfolio, and we will test to see if a and B appear to be constant over a specified sub-sample. Obtain the returns data from January 2011 to December 2020 through WRDS. We will split the sample into two equal-size five-year sub-samples. Sub-sample I is January 2011 to December 2015, and sub-sample II is January 2016 to December 2020. For the structural change tests, you will need to create the dummy variable D { 1, otherwisember 2015; 0, You can do this in Excel using the IF and DATEVALUE functions. Once you have the variable Dt you will need to create the interaction variable Dr. Pm,t- a. For both assets, estimate the restricted single index model regression using the full 10 years of data. i. Comment briefly on the values of a; and B; and on the fit of the regression equation. ii. Record the value of residual sum of squares (RSSR) from the ANOVA table in the Excel regression output (from the row labeled Residual and the column labeled SS). You will use this for the F-test later on. b. For both assets, estimate the unrestricted single index model regression allowing only B; to be different over the two sub-samples: rint Q; + BPm,t + 8;(Dz. Pm,t) + @i,t i. Comment briefly on the values of ai, B; and 8; and on the fit of the regression equation. ii. Given the estimated values of B; and di, what are the estimates of the beta over the first sub-sample and over the second sub-sample. Comment briefly. iii. Use a t-statistic on d; and a 5% significance level to test the null hypothesis that beta is constant over the two sub-samples. What do you find? c. For both assets, estimate the unrestricted single index model regression allowing both a; and B; to be different over the two sub-samples: Tant = ; + Bim,t +7;D+ +8;(Dz. im,t) + Eint i. Comment briefly on the values of ai, Bi, Y. and 8; and on the fit of the regression equation. ii. Given the estimated values of ai, Big Vi and di, what are the estimates of alpha and beta over the first sub-sample and over the second sub-sample. Comment briefly. iii. Using individual t-statistics on Y; and d; and a 5% significance level to test the null hypotheses that alpha is constant is constant over the two sub-samples and beta is constant over the two sub-samples. What do you find? iv. Record the value of residual sum of squares (RSSUR) from the ANOVA table in the Excel regression output (from the row labeled Residual and the column labeled SS). Use an F-statistic and a 5% significance level to test the hypothesis that both alpha and beta are the same over both sub-samples. What do you find


