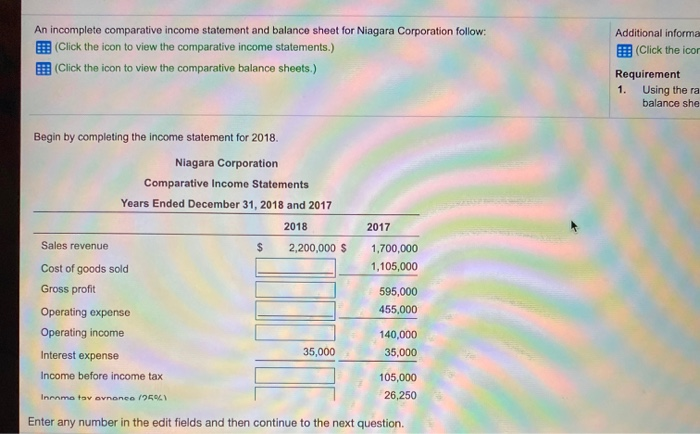
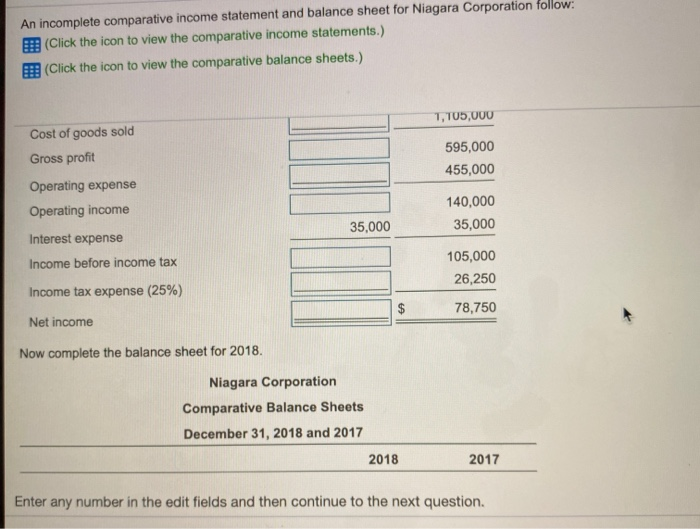
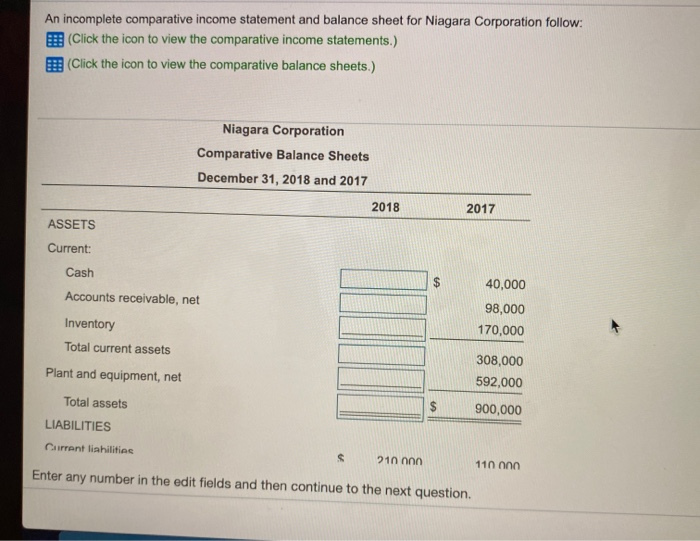
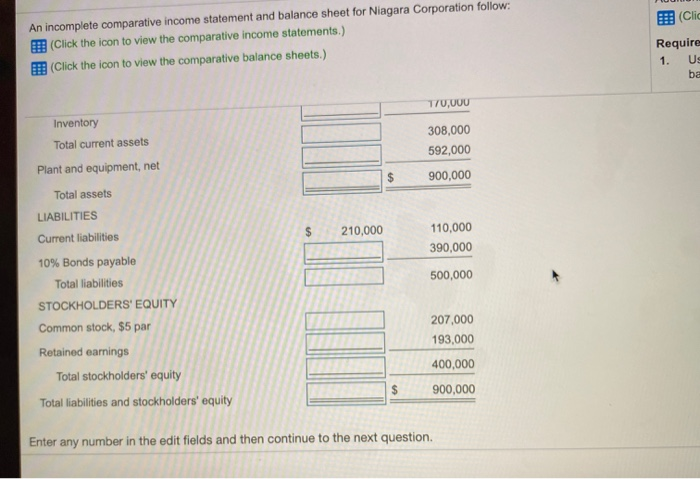
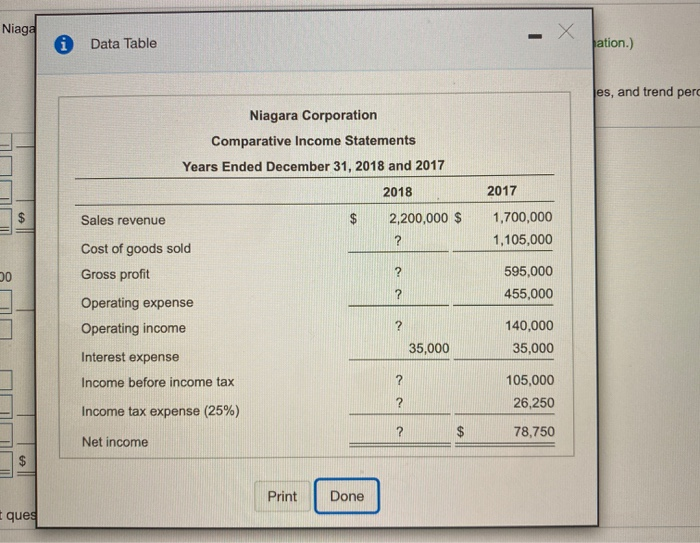
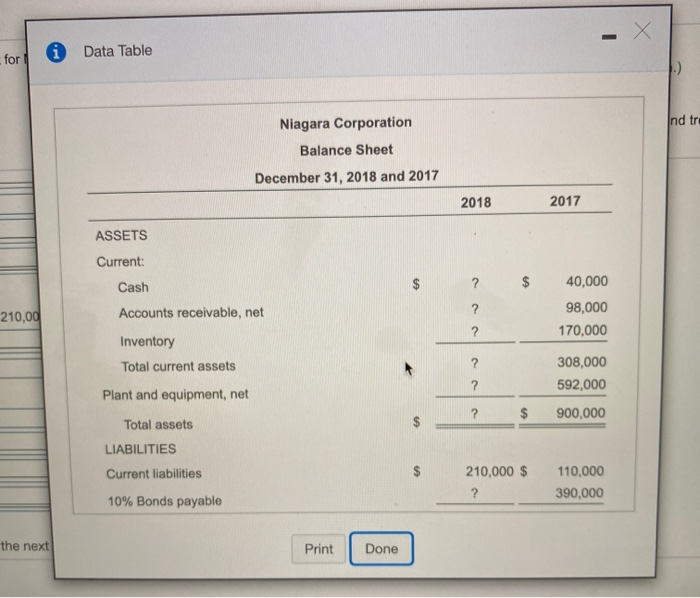
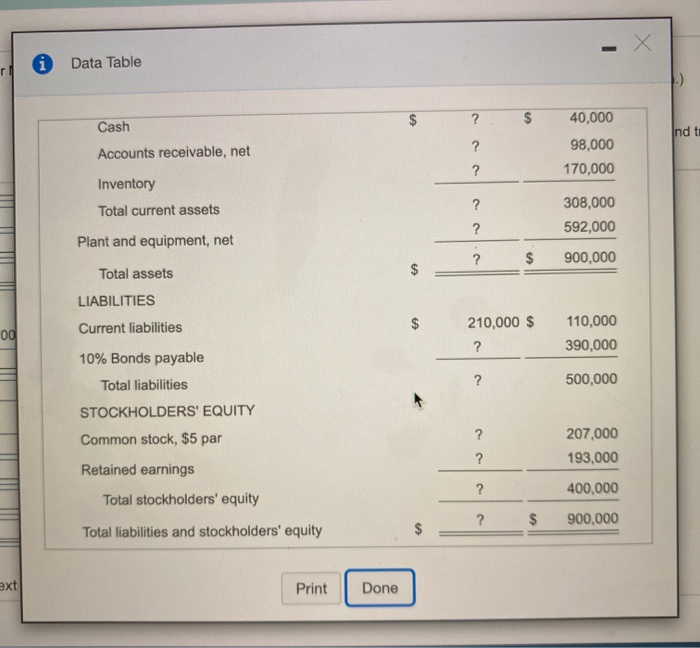
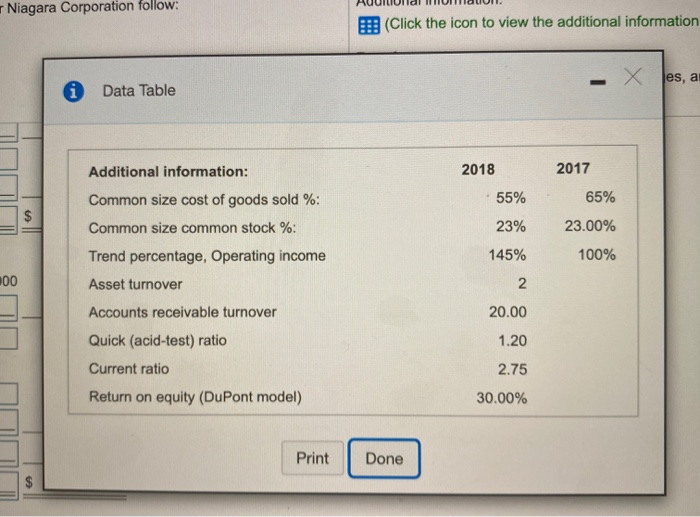
An incomplete comparative income statement and balance sheet for Niagara Corporation follow: Click the icon to view the comparative income statements.) (Click the icon to view the comparative balance sheets.) Additional informa (Click the icon Requirement 1. Using the ra balance she 2017 Begin by completing the income statement for 2018. Niagara Corporation Comparative Income Statements Years Ended December 31, 2018 and 2017 2018 Sales revenue $ 2,200,000 $ Cost of goods sold Gross profit Operating expense Operating income Interest expense 35,000 Income before income tax 1,700,000 1,105,000 595,000 455,000 140,000 35,000 105,000 26,250 Income tav ovnenee 1954 Enter any number in the edit fields and then continue to the next question. An incomplete comparative income statement and balance sheet for Niagara Corporation follow: (Click the icon to view the comparative income statements.) (Click the icon to view the comparative balance sheets.) 7,105,000 Cost of goods sold Gross profit 595,000 455,000 Operating expense Operating income 140,000 35,000 35,000 Interest expense Income before income tax 105,000 26,250 Income tax expense (25%) $ 78,750 Net income Now complete the balance sheet for 2018. Niagara Corporation Comparative Balance Sheets December 31, 2018 and 2017 2018 2017 Enter any number in the edit fields and then continue to the next question. An incomplete comparative income statement and balance sheet for Niagara Corporation follow: (Click the icon to view the comparative income statements.) (Click the icon to view the comparative balance sheets.) Niagara Corporation Comparative Balance Sheets December 31, 2018 and 2017 2018 2017 ASSETS Current: Cash $ 40,000 Accounts receivable, net Inventory 98,000 170,000 Total current assets Plant and equipment, net 308,000 592,000 900,000 Total assets LIABILITIES $ Current liabilities $ 210 non 11n Onn Enter any number in the edit fields and then continue to the next question. (Clic An incomplete comparative income statement and balance sheet for Niagara Corporation follow: (Click the icon to view the comparative income statements.) (Click the icon to view the comparative balance sheets.) Require 1. US ba T70,000 Inventory Total current assets 308,000 592,000 900,000 Plant and equipment, net Total assets LIABILITIES Current liabilities $ 210,000 110,000 390,000 500,000 10% Bonds payable Total liabilities STOCKHOLDERS' EQUITY Common stock, $5 par Retained earnings Total stockholders' equity Total liabilities and stockholders' equity 207.000 193,000 400,000 900,000 Enter any number in the edit fields and then continue to the next question. Niaga - X Data Table ation.) es, and trend perd Niagara Corporation Comparative Income Statements Years Ended December 31, 2018 and 2017 2018 2017 Sales revenue $ 2,200,000 $ 1,700,000 1,105,000 ? Cost of goods sold Gross profit 00 ? 595,000 455,000 ? Operating expense Operating income ? 140,000 35,000 35,000 Interest expense Income before income tax ? 105,000 26,250 ? Income tax expense (25%) ? 78,750 Net income $ Print Done t que Data Table for Ind tr Niagara Corporation Balance Sheet December 31, 2018 and 2017 2018 2017 ASSETS Current: Cash $ ? ? Accounts receivable, net 40,000 98,000 170,000 210,00 ? Inventory Total current assets ? 308,000 592,000 ? Plant and equipment, net ? $ 900,000 Total assets LIABILITIES Current liabilities 210,000 $ ? 110,000 390,000 10% Bonds payable the next Print Done i Data Table $ ? Cash $ nd to ? 40,000 98,000 170,000 Accounts receivable, net ? Inventory Total current assets ? 308,000 592,000 ? Plant and equipment, net 2 ? $ $ 900,000 Total assets LIABILITIES od Current liabilities 210,000 $ ? 110,000 390,000 10% Bonds payable Total liabilities ? 500,000 STOCKHOLDERS' EQUITY Common stock, $5 par ? 207,000 193,000 ? Retained earnings Total stockholders' equity ? 400,000 ? $ 900,000 Total liabilities and stockholders' equity $ ext Print Done Niagara Corporation follow: (Click the icon to view the additional information x les, a Data Table 2018 2017 65% 55% $ Additional information: Common size cost of goods sold %: Common size common stock %: Trend percentage, Operating income Asset turnover 23% 23.00% 145% 100% 200 2 Accounts receivable turnover 20.00 Quick (acid-test) ratio 1.20 Current ratio 2.75 Return on equity (DuPont model) 30.00% Print Done
