An Industrial-Organizational Psychologist wants to use scores on a cognitive ability test (range from 0-7; higher scores indicate more cognitive ability) as a selection

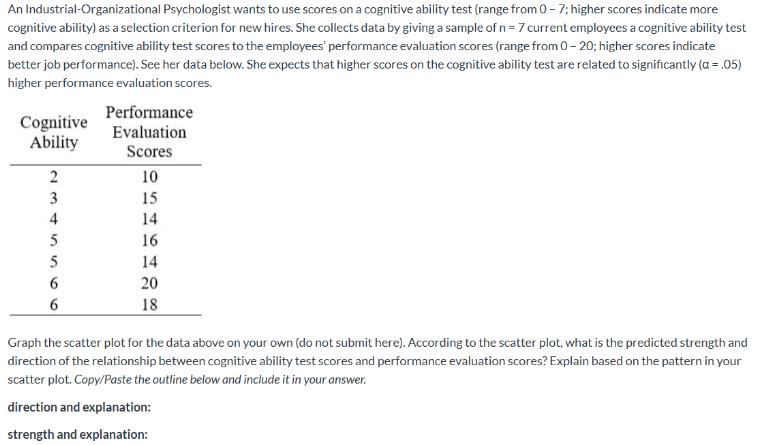
An Industrial-Organizational Psychologist wants to use scores on a cognitive ability test (range from 0-7; higher scores indicate more cognitive ability) as a selection criterion for new hires. She collects data by giving a sample of n = 7 current employees a cognitive ability test and compares cognitive ability test scores to the employees' performance evaluation scores (range from 0-20; higher scores indicate better job performance). See her data below. She expects that higher scores on the cognitive ability test are related to significantly (a = .05) higher performance evaluation scores. Cognitive Ability 2 234 4 5 5 6 6 Performance Evaluation Scores 10 15 14 16 14 20 18 Graph the scatter plot for the data above on your own (do not submit here). According to the scatter plot, what is the predicted strength and direction of the relationship between cognitive ability test scores and performance evaluation scores? Explain based on the pattern in your scatter plot. Copy/Paste the outline below and include it in your answer. direction and explanation: strength and explanation:
Step by Step Solution
3.44 Rating (151 Votes )
There are 3 Steps involved in it
Step: 1
SOLUTION Direction and Explanation The scatter plot shows a positive direction of the relationship b...
See step-by-step solutions with expert insights and AI powered tools for academic success
Step: 2

Step: 3

Ace Your Homework with AI
Get the answers you need in no time with our AI-driven, step-by-step assistance
Get Started


