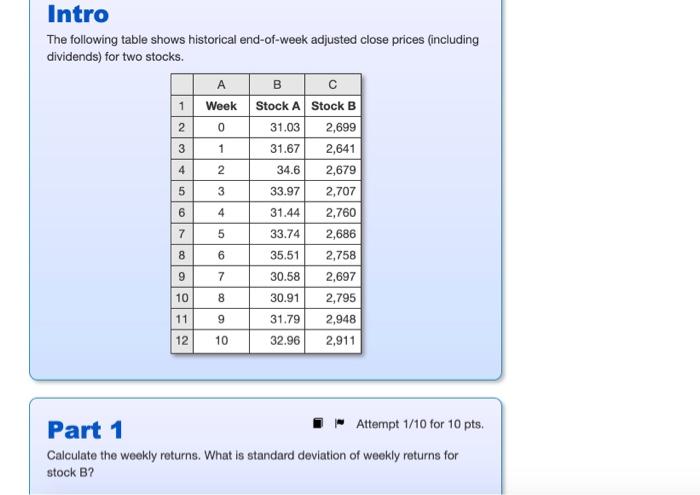
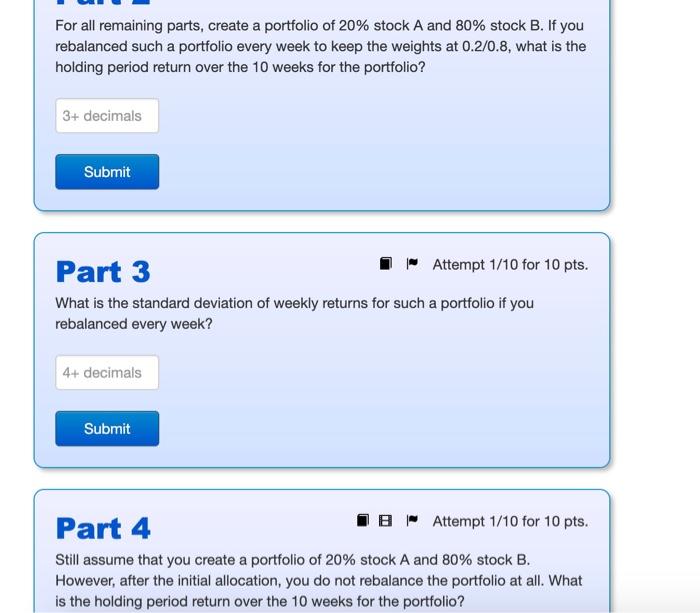
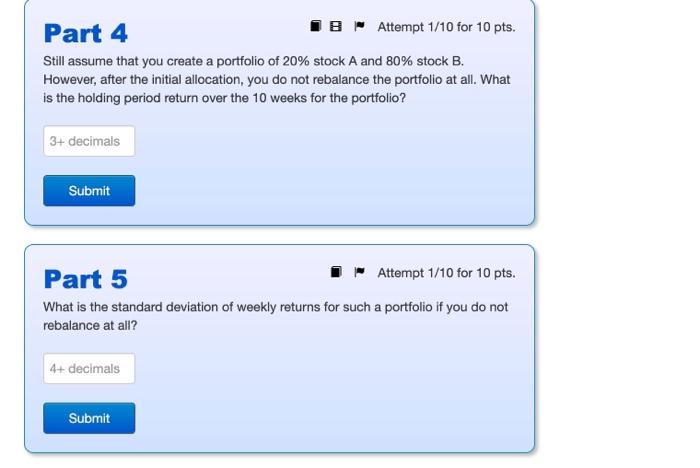
AN Intro The following table shows historical end-of-week adjusted close prices (including dividends) for two stocks. A B 1 Week Stock A Stock B 2 0 31.03 2,699 3 1 31.67 2,641 2 34.6 2,679 5 3 33.97 2,707 6 4 31.44 2,760 7 5 33.74 2,686 8 6 35.51 2,758 7 30.58 2,697 10 8 30.91 2,795 11 31.79 2,948 12 10 32.96 2,911 ON 9 9 Part 1 Attempt 1/10 for 10 pts. Calculate the weekly returns. What is standard deviation of weekly returns for stock B? For all remaining parts, create a portfolio of 20% stock A and 80% stock B. If you rebalanced such a portfolio every week to keep the weights at 0.2/0.8, what is the holding period return over the 10 weeks for the portfolio? 3+ decimals Submit Part 3 Attempt 1/10 for 10 pts. What is the standard deviation of weekly returns for such a portfolio if you rebalanced every week? 4+ decimals Submit Part 4 IB Attempt 1/10 for 10 pts. Still assume that you create a portfolio of 20% stock A and 80% stock B. However, after the initial allocation, you do not rebalance the portfolio at all. What is the holding period return over the 10 weeks for the portfolio? Part 4 IB Attempt 1/10 for 10 pts. Still assume that you create a portfolio of 20% stock A and 80% stock B. However, after the initial allocation, you do not rebalance the portfolio at all. What is the holding period return over the 10 weeks for the portfolio? 3+ decimals Submit Part 5 Attempt 1/10 for 10 pts. What is the standard deviation of weekly returns for such a portfolio if you do not rebalance at all? 4+ decimals Submit AN Intro The following table shows historical end-of-week adjusted close prices (including dividends) for two stocks. A B 1 Week Stock A Stock B 2 0 31.03 2,699 3 1 31.67 2,641 2 34.6 2,679 5 3 33.97 2,707 6 4 31.44 2,760 7 5 33.74 2,686 8 6 35.51 2,758 7 30.58 2,697 10 8 30.91 2,795 11 31.79 2,948 12 10 32.96 2,911 ON 9 9 Part 1 Attempt 1/10 for 10 pts. Calculate the weekly returns. What is standard deviation of weekly returns for stock B? For all remaining parts, create a portfolio of 20% stock A and 80% stock B. If you rebalanced such a portfolio every week to keep the weights at 0.2/0.8, what is the holding period return over the 10 weeks for the portfolio? 3+ decimals Submit Part 3 Attempt 1/10 for 10 pts. What is the standard deviation of weekly returns for such a portfolio if you rebalanced every week? 4+ decimals Submit Part 4 IB Attempt 1/10 for 10 pts. Still assume that you create a portfolio of 20% stock A and 80% stock B. However, after the initial allocation, you do not rebalance the portfolio at all. What is the holding period return over the 10 weeks for the portfolio? Part 4 IB Attempt 1/10 for 10 pts. Still assume that you create a portfolio of 20% stock A and 80% stock B. However, after the initial allocation, you do not rebalance the portfolio at all. What is the holding period return over the 10 weeks for the portfolio? 3+ decimals Submit Part 5 Attempt 1/10 for 10 pts. What is the standard deviation of weekly returns for such a portfolio if you do not rebalance at all? 4+ decimals Submit


