Question
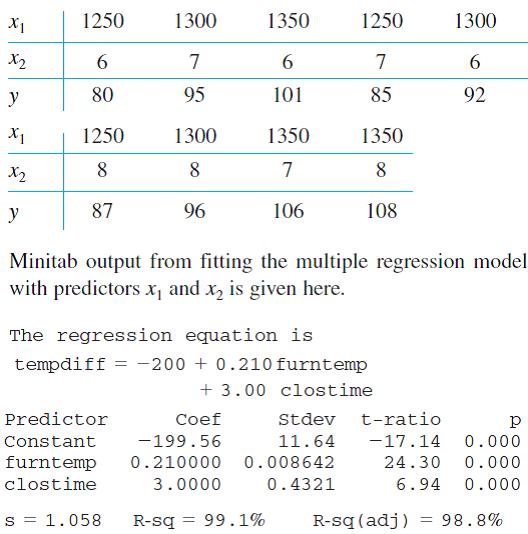
An investigation of a die-casting process resulted in the accompanying data on x 1 = furnace temperature , x 2 = die close time, and
An investigation of a die-casting process resulted in the accompanying data on x1= furnace temperature , x2 = die close time, and y = temperature difference on the die surface (“A Multiple-Objective Decision-Making Approach for Assessing Simultaneous Improvement in Die Life and Casting Quality in a Die Casting Process,” Quality Engineering, 1994: 371–383).

Minitab output from fitting the multiple regression model with predictors x1 and x2 is given here.

a. Carry out the model utility test.
b. Calculate and interpret a 95% confidence interval for β2, the population regression coefficient of x2.

c. When x1 = 1300 and x2 = 7 , the estimated standard deviation of Calculate a 95% confidence interval for true average temperature difference when furnace temperature is 1300 and die close time is 7.
d. Calculate a 95% prediction interval for the temperature difference resulting from a single experimental run with a furnace temperature of 1300 and a die close time of 7.
X = x2 X1 x2 y X1 x2 y 1250 6 80 1250 8 87 1300 7 95 1300 8 96 s = 1.058 Predictor Coef Constant -199.56 furntemp 0.210000 clostime 3.0000 R-sq 1350 6 101 Minitab output from fitting the multiple regression model with predictors x, and x is given here. The regression equation is tempdiff = -200+ 0.210 furntemp +3.00 clostime = 1350 7 106 99.1% 1250 7 85 1350 8 108 0.008642 0.4321 Stdev t-ratio 11.64 -17.14 24.30 6.94 1300 6 92 = 0.000 0.000 0.000 R-sq (adj) 98.8%
Step by Step Solution
3.55 Rating (155 Votes )
There are 3 Steps involved in it
Step: 1

Get Instant Access to Expert-Tailored Solutions
See step-by-step solutions with expert insights and AI powered tools for academic success
Step: 2

Step: 3

Ace Your Homework with AI
Get the answers you need in no time with our AI-driven, step-by-step assistance
Get Started


