
Answered step by step
Verified Expert Solution
Link Copied!

Question

1 Approved Answer

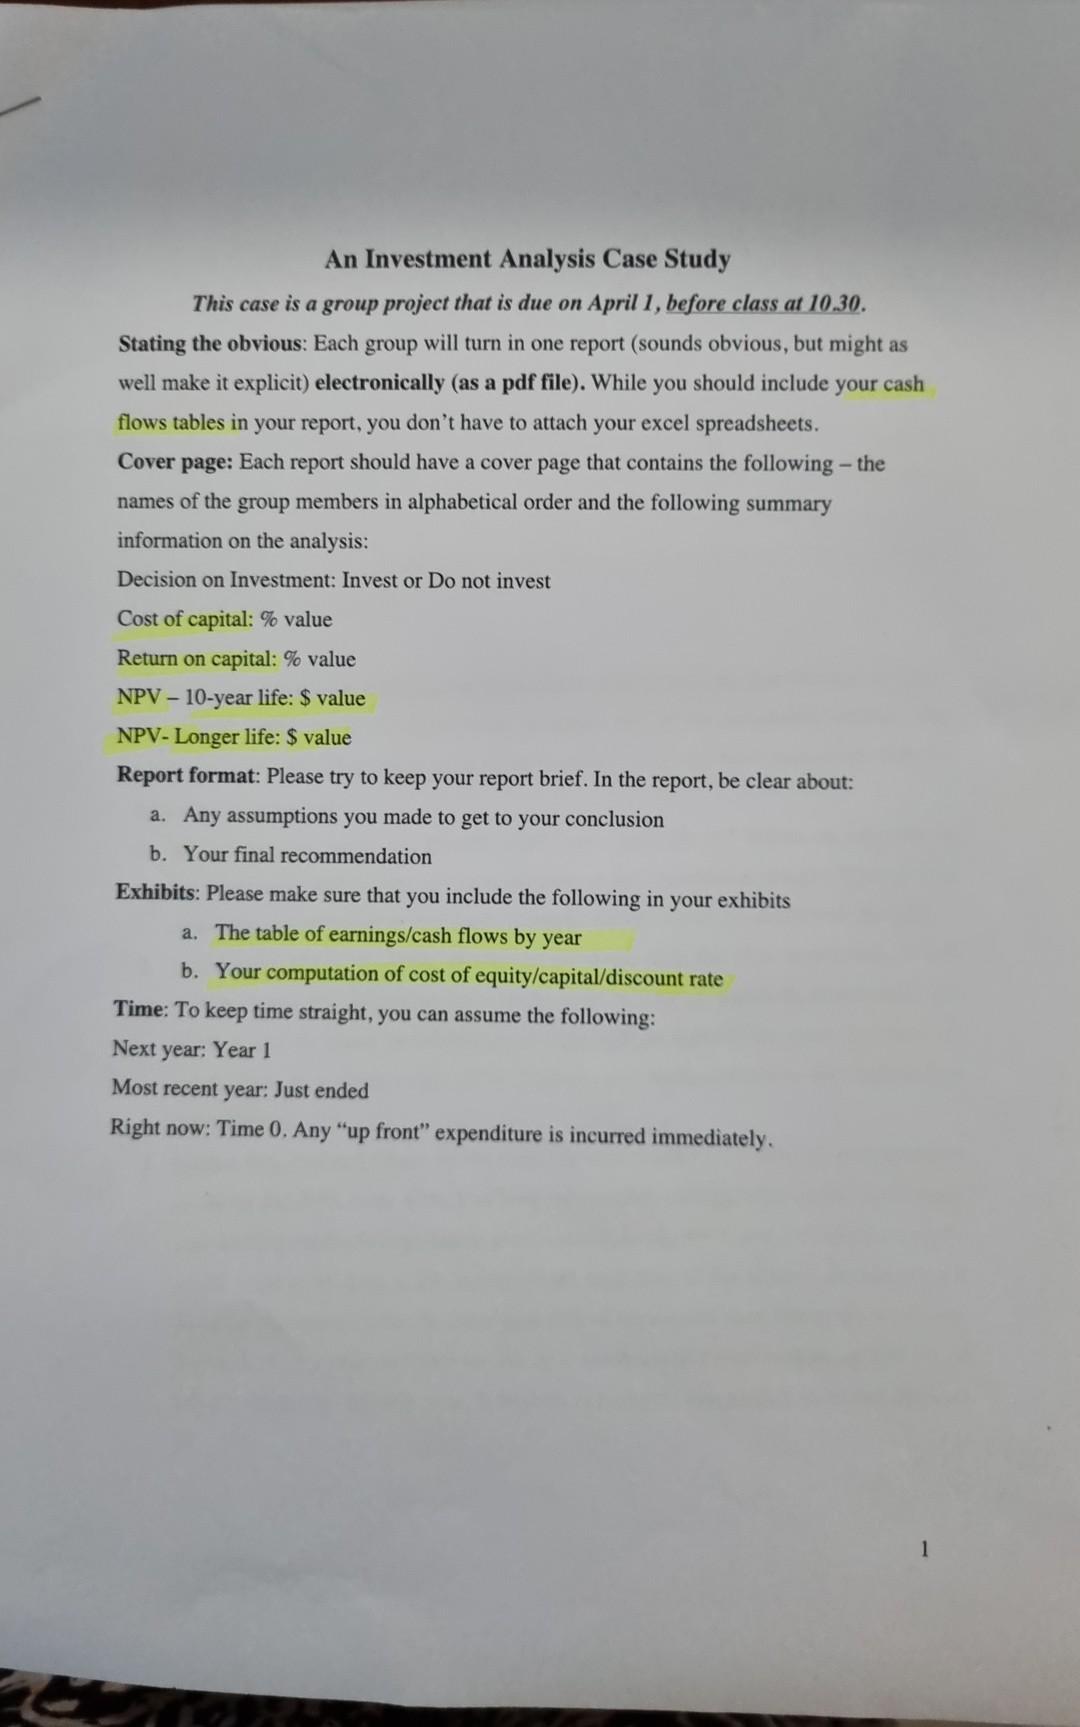
An Investment Analysis Case Study This case is a group project that is due on April 1, before class at 10.30. Stating the obvious: Each

image text in transcribed

image text in transcribed

image text in transcribed

image text in transcribed

image text in transcribed

image text in transcribed

image text in transcribed

image text in transcribed

image text in transcribed

image text in transcribed

image text in transcribed

image text in transcribed

image text in transcribed

image text in transcribed

image text in transcribed

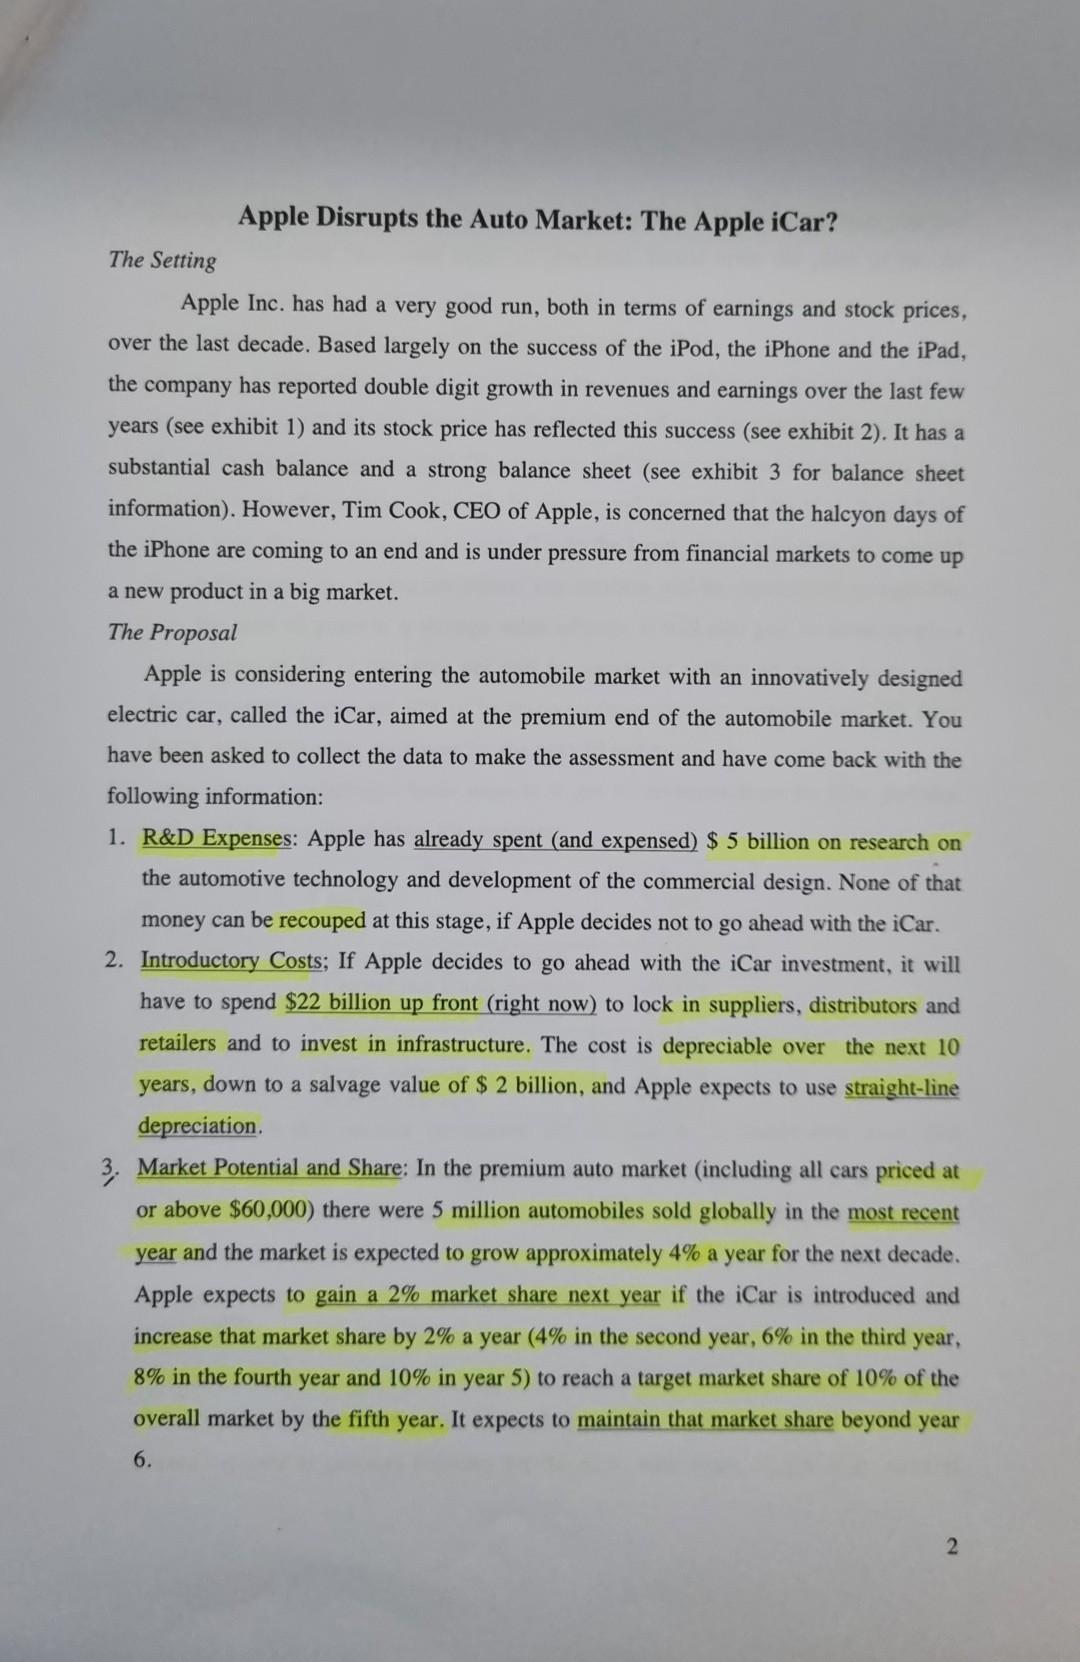
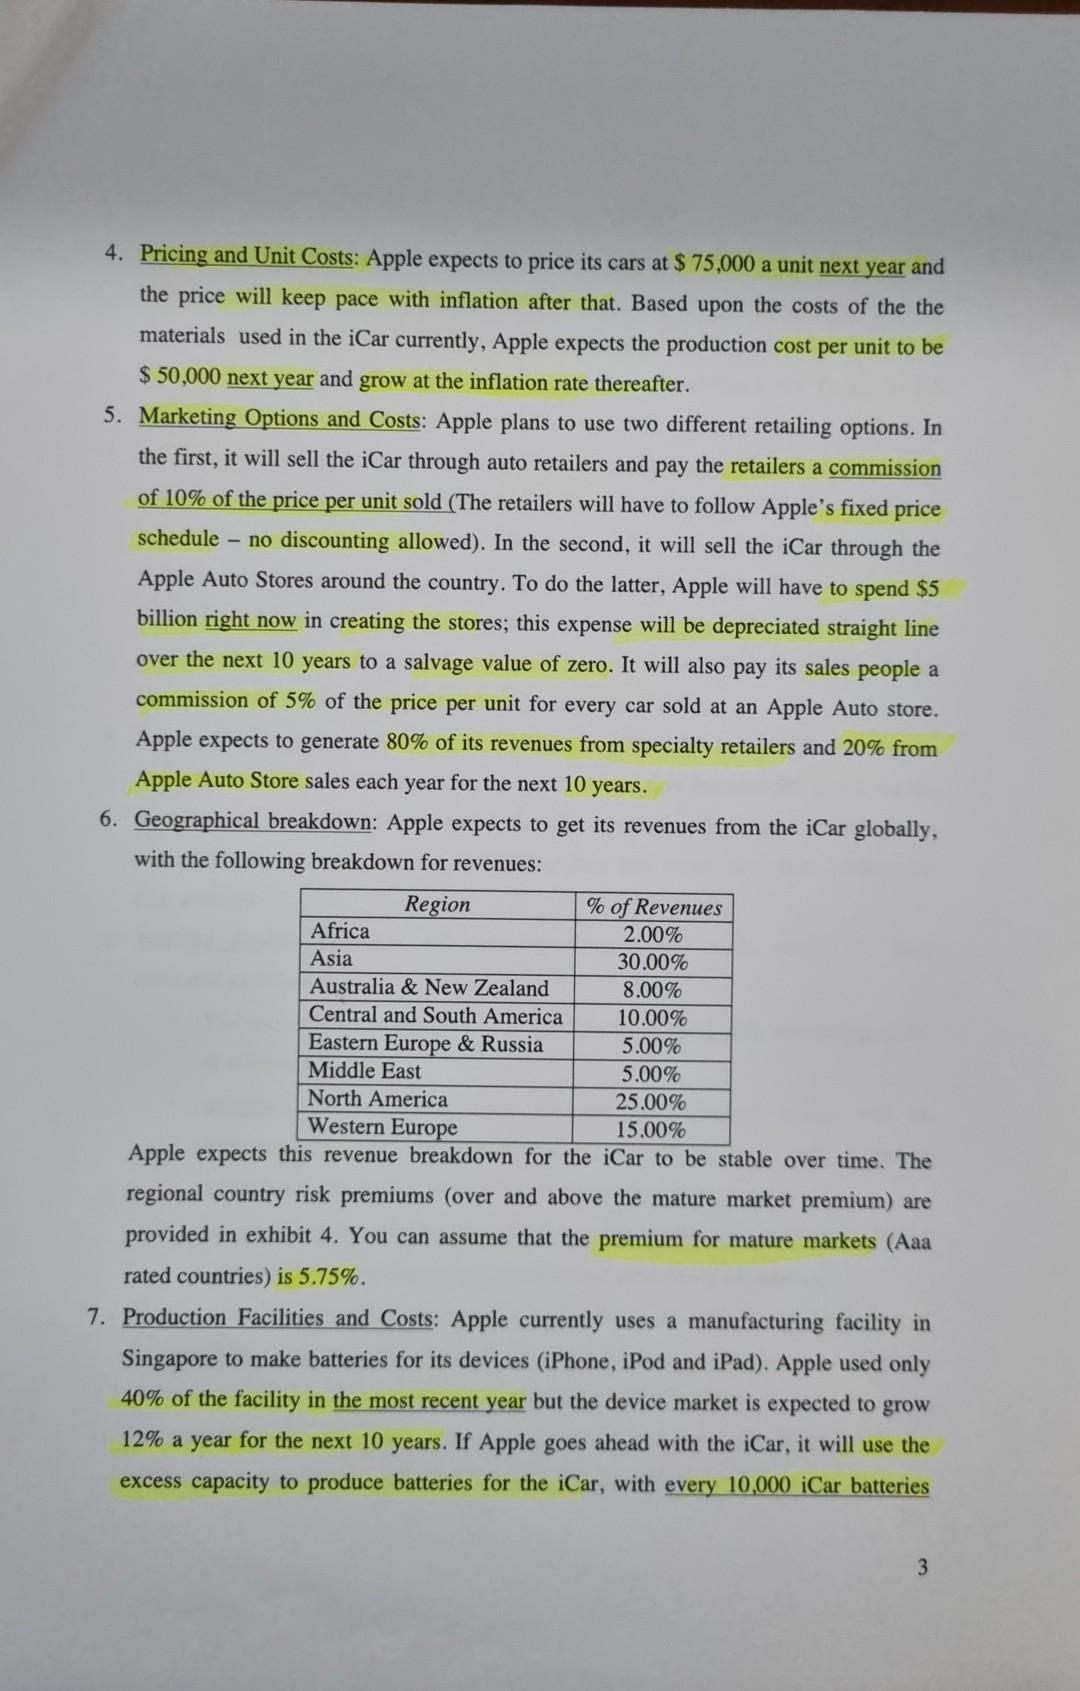
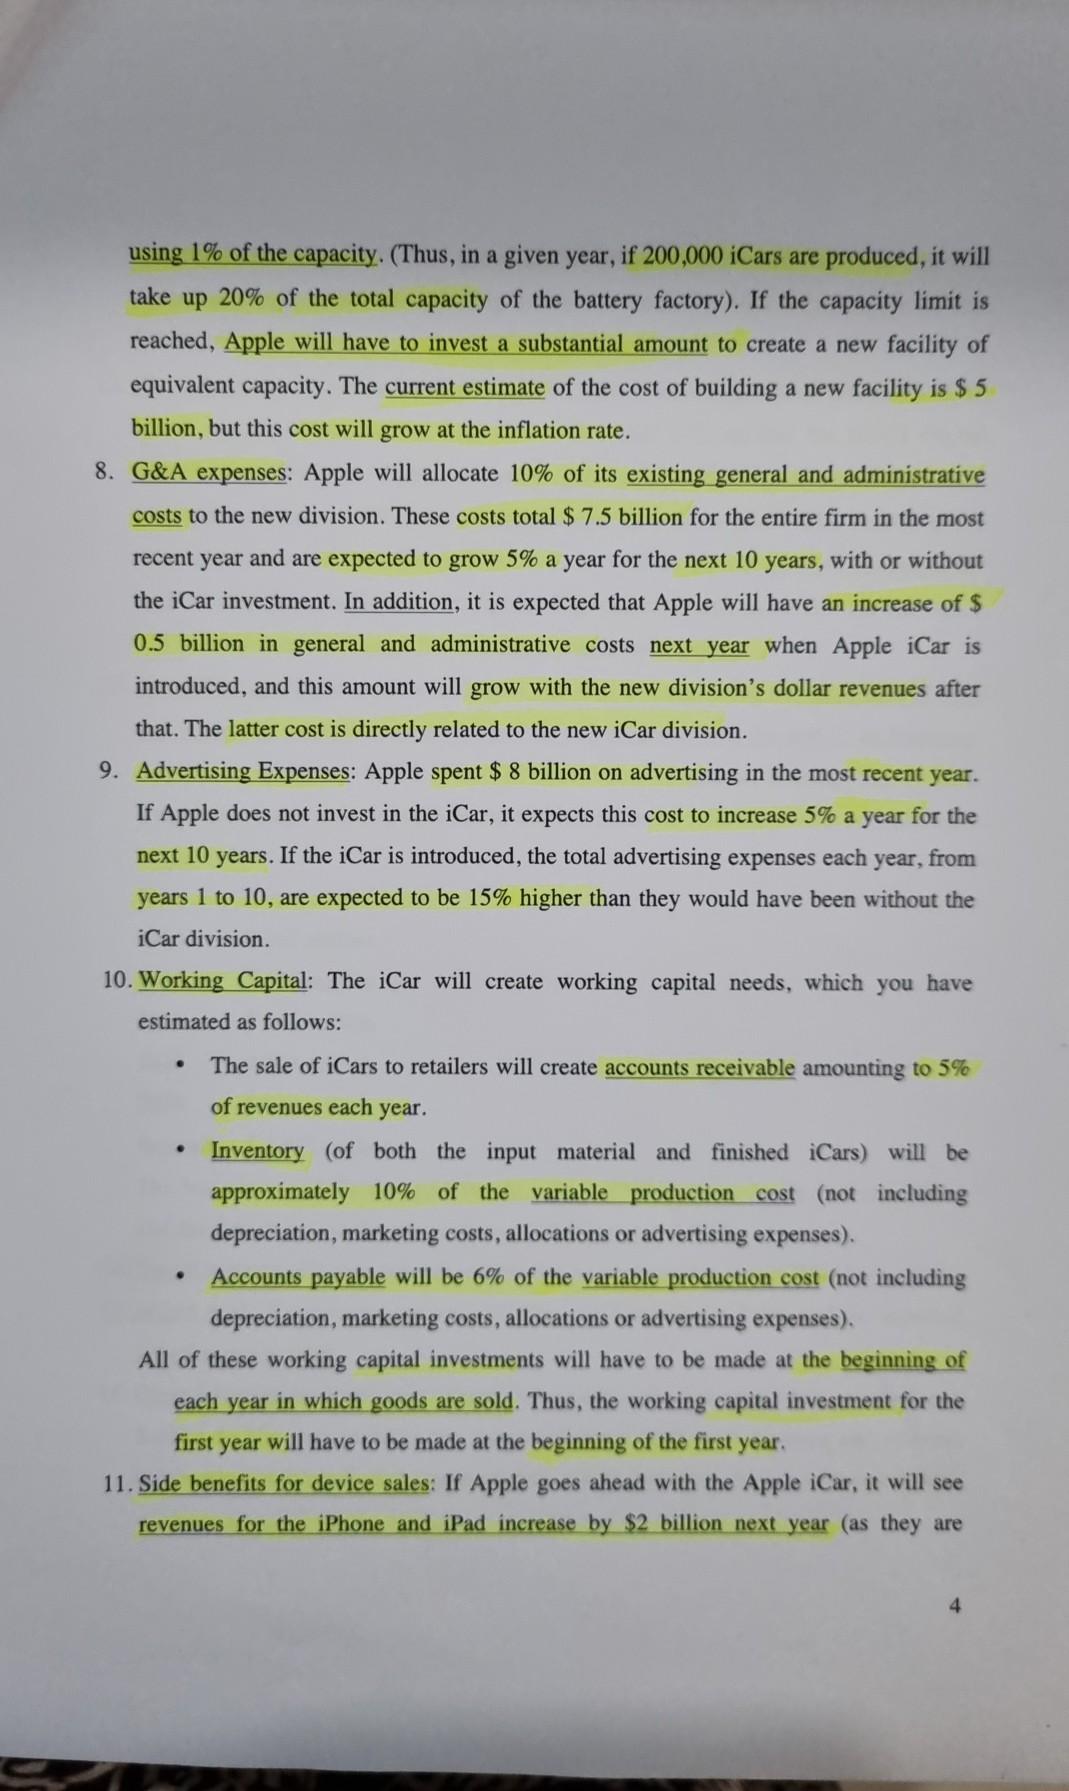
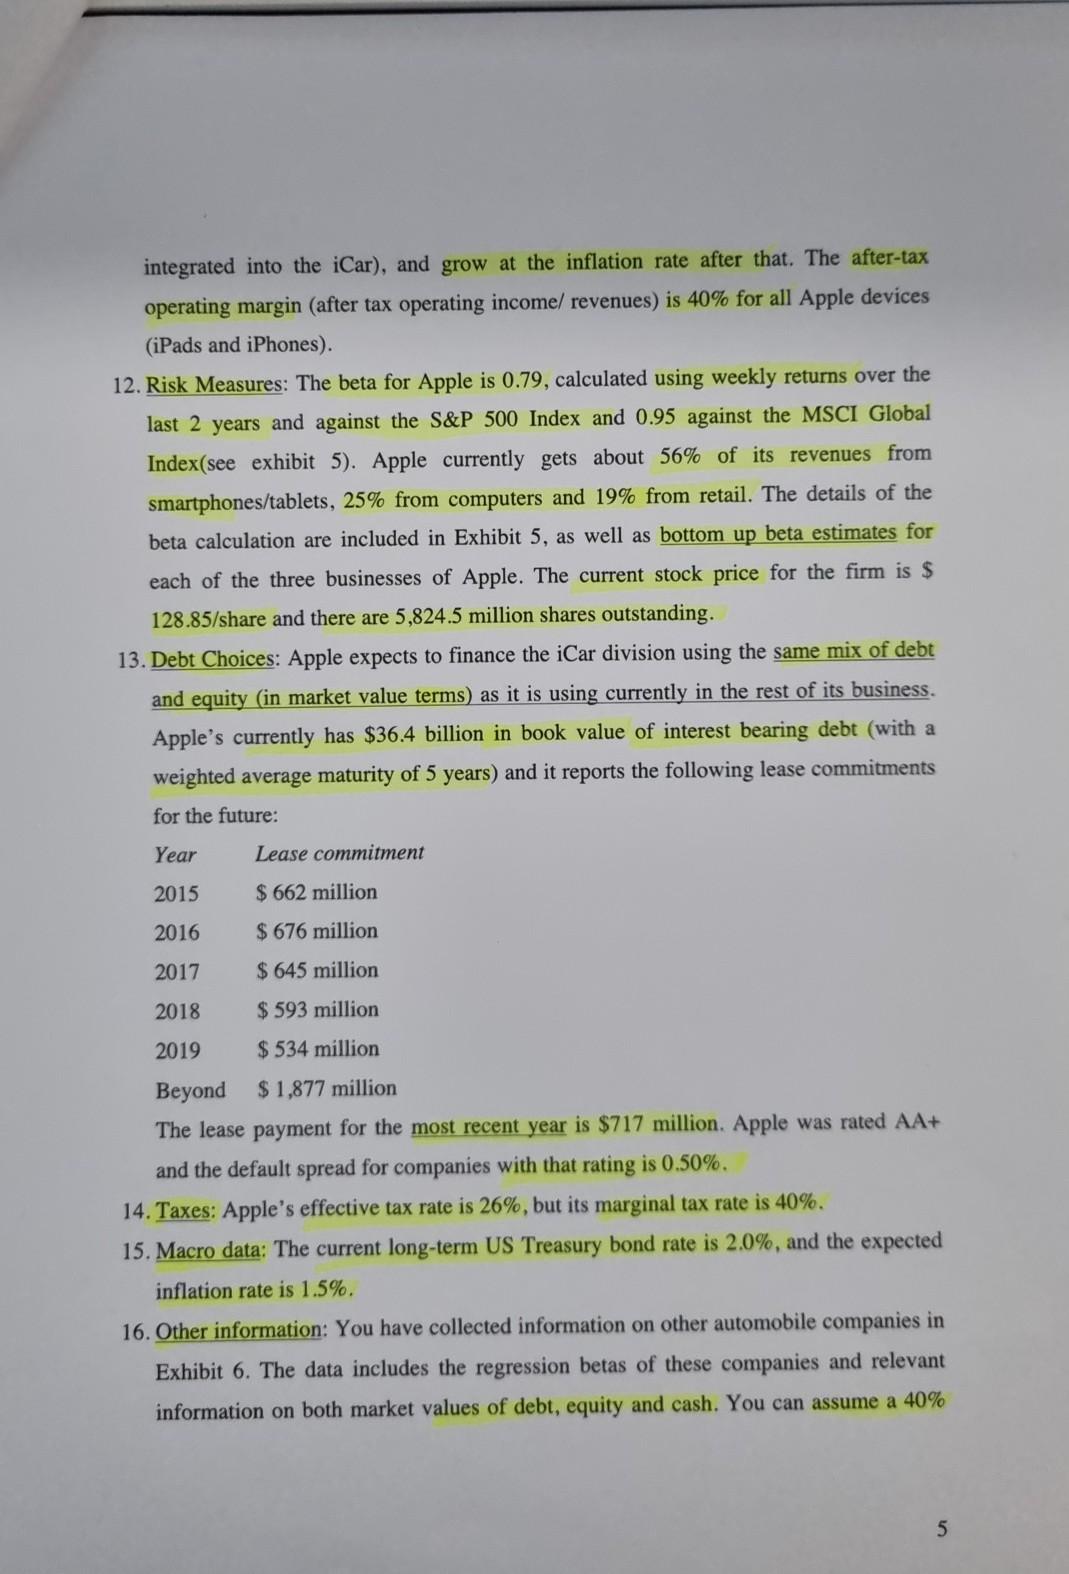
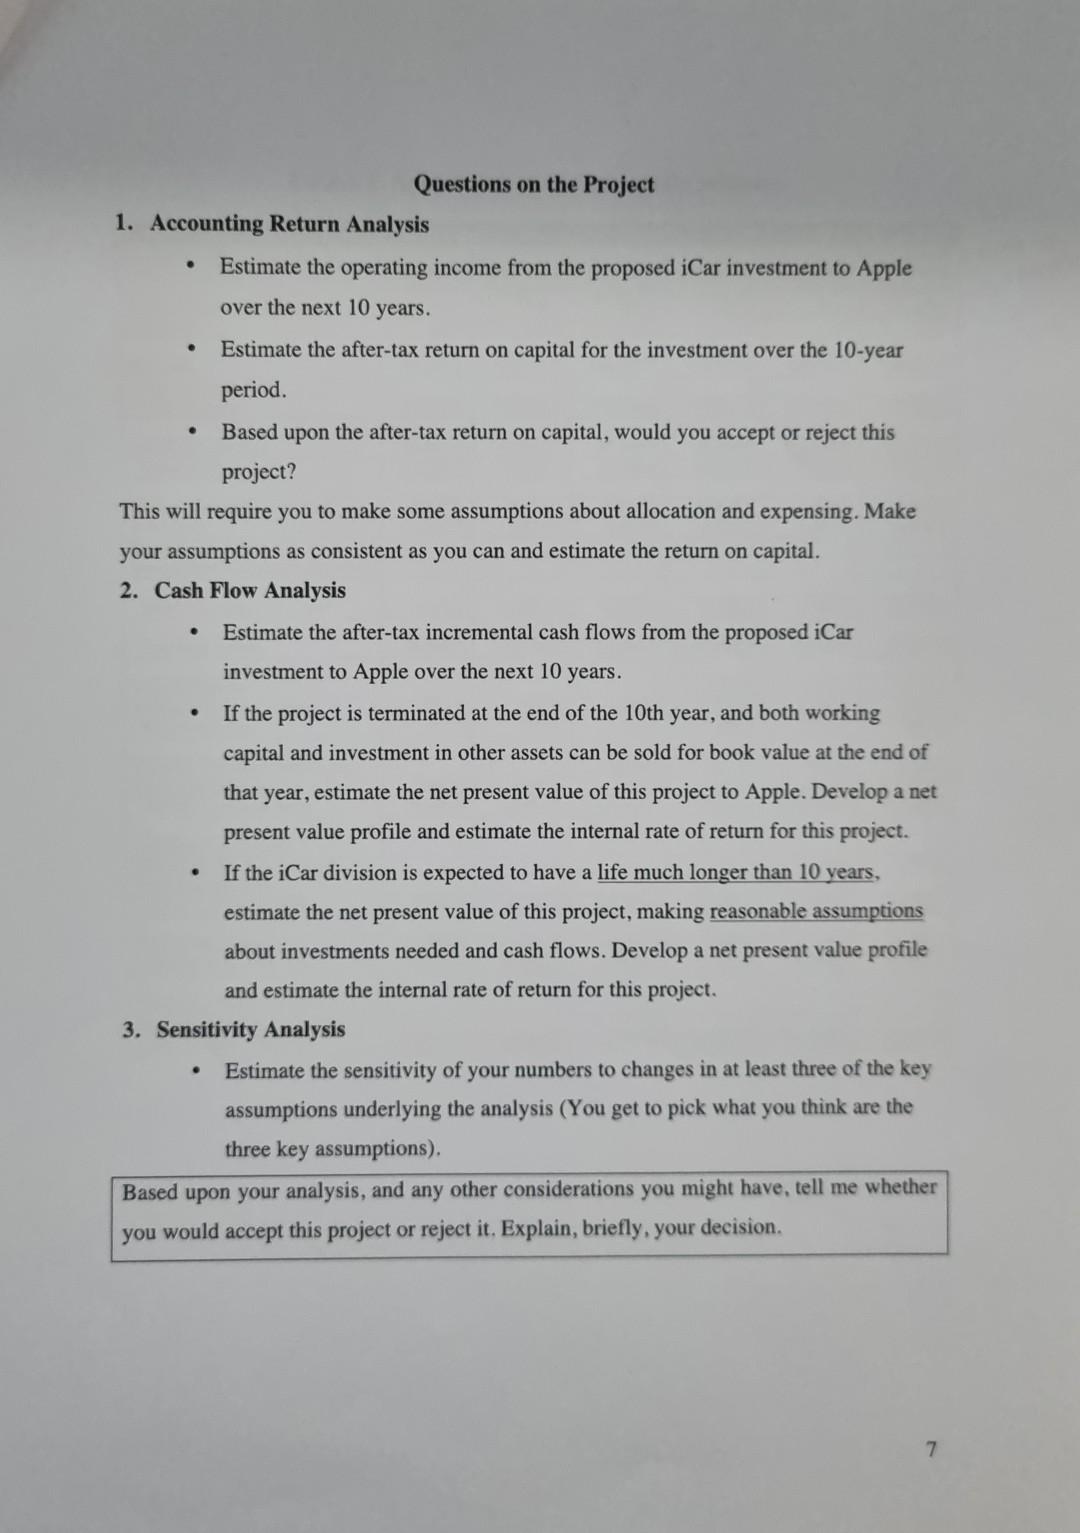
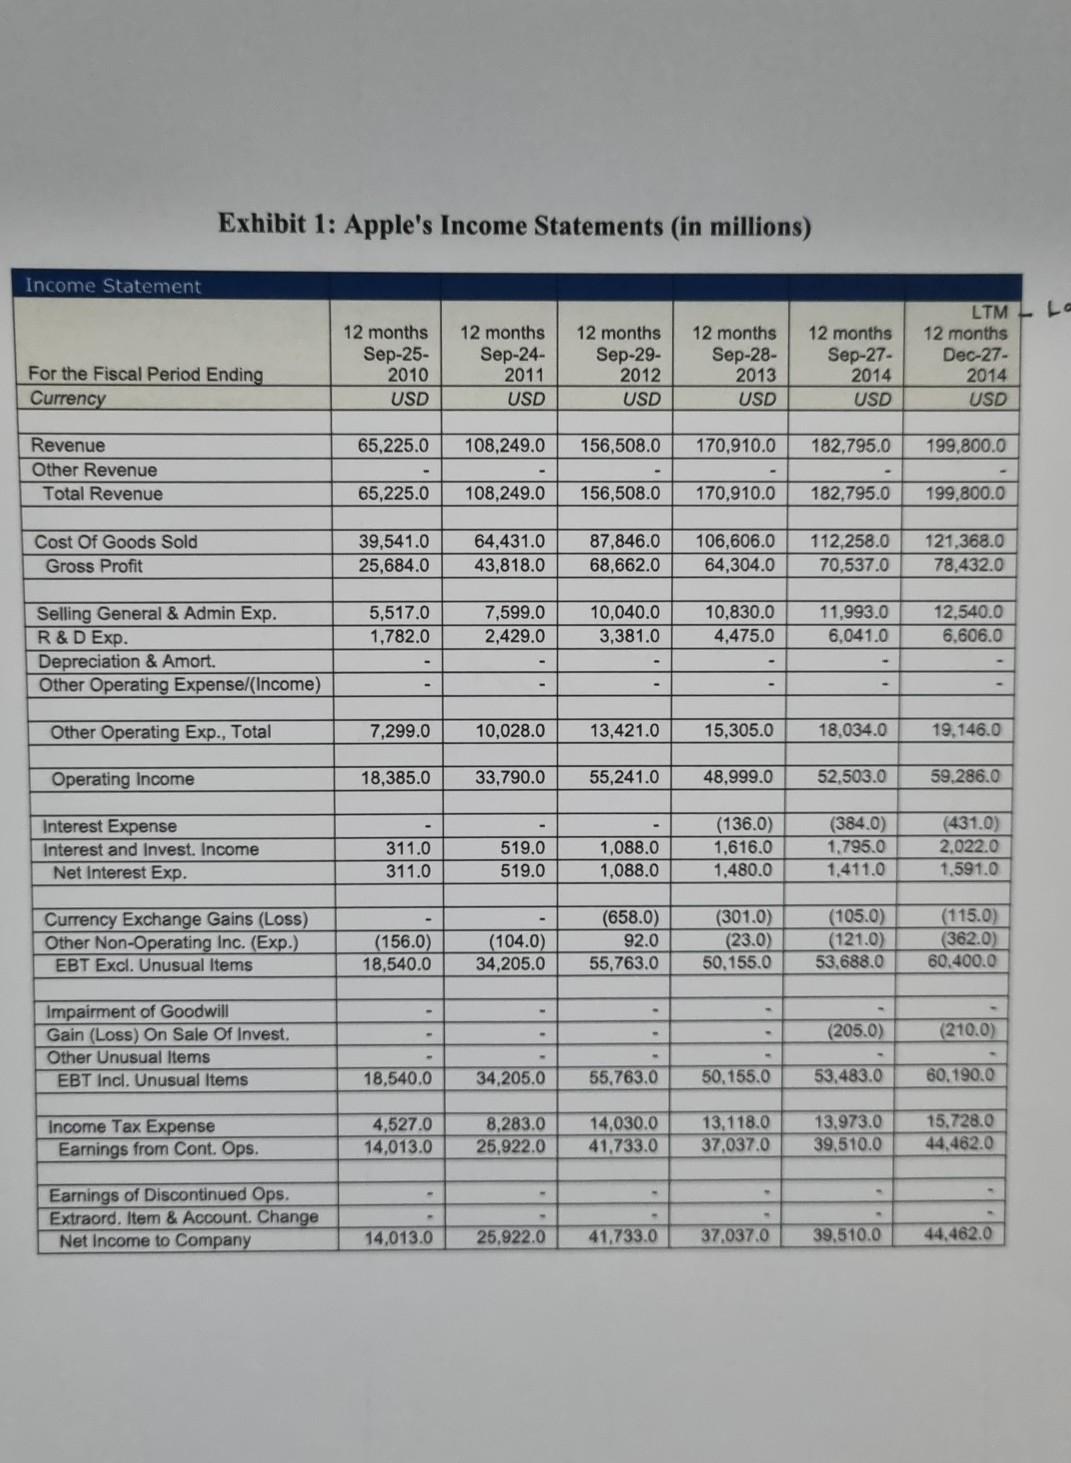
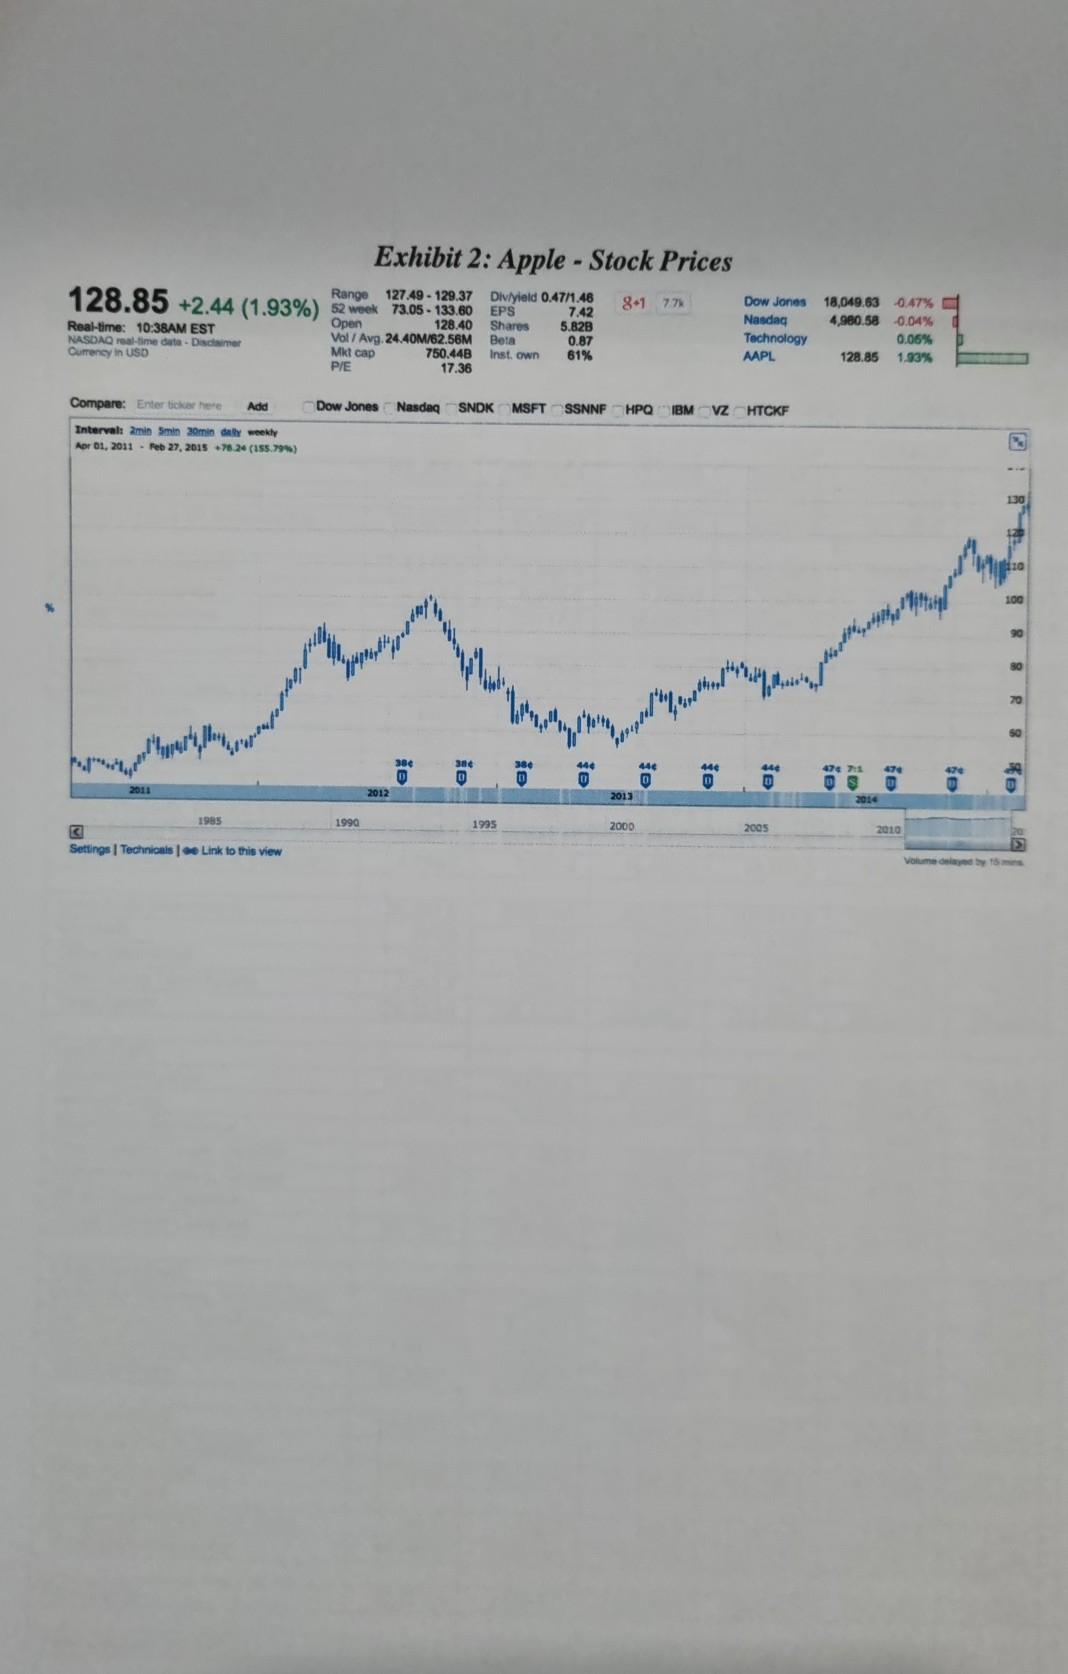
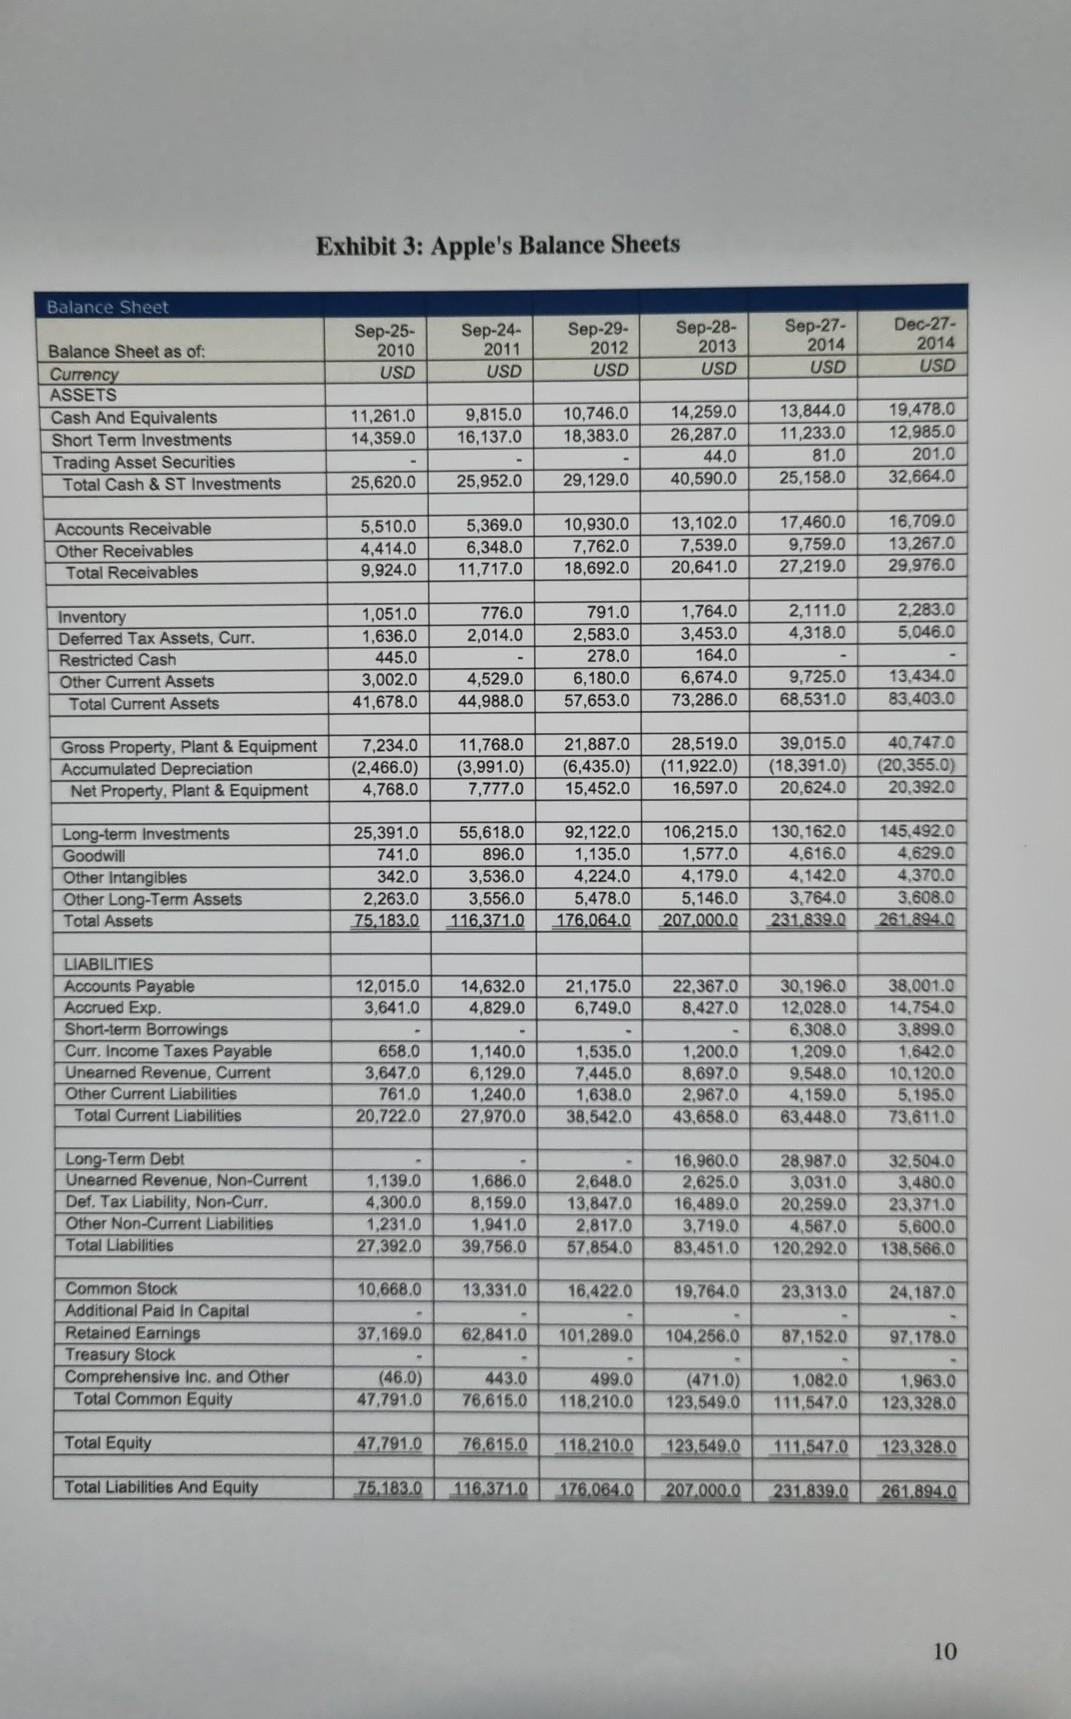
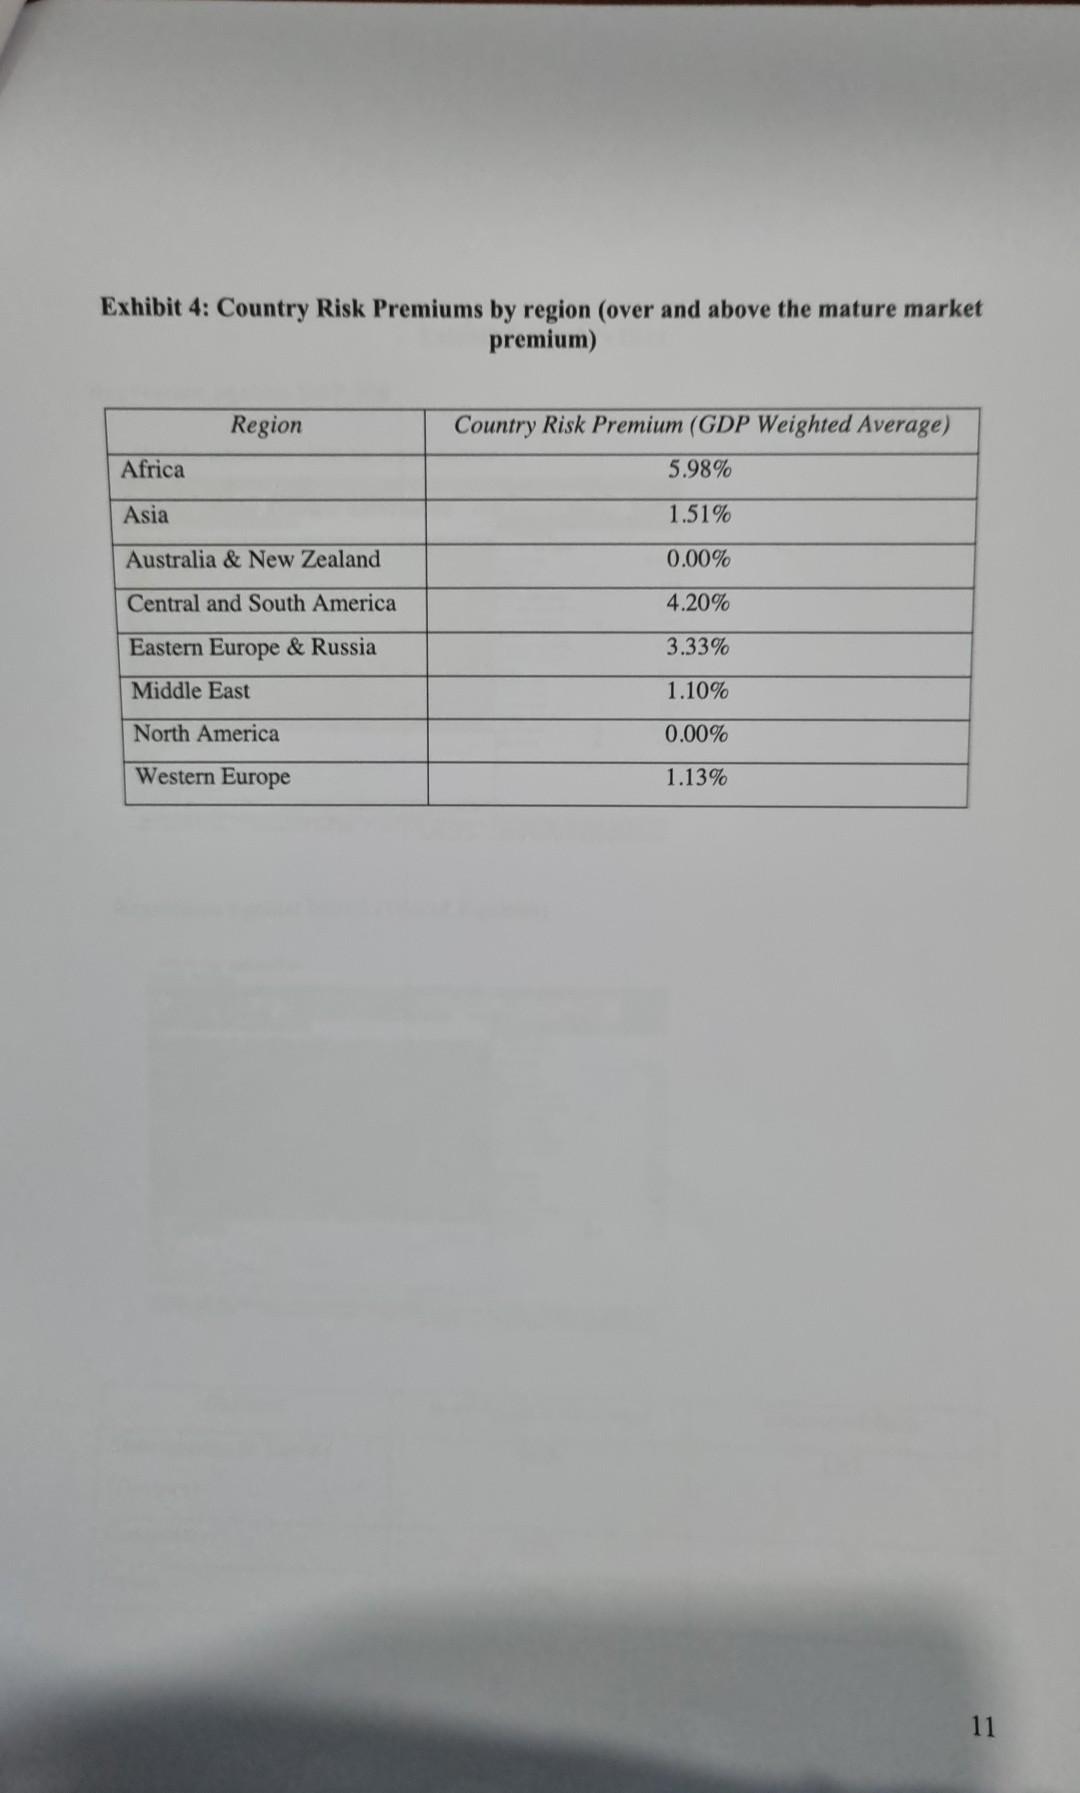
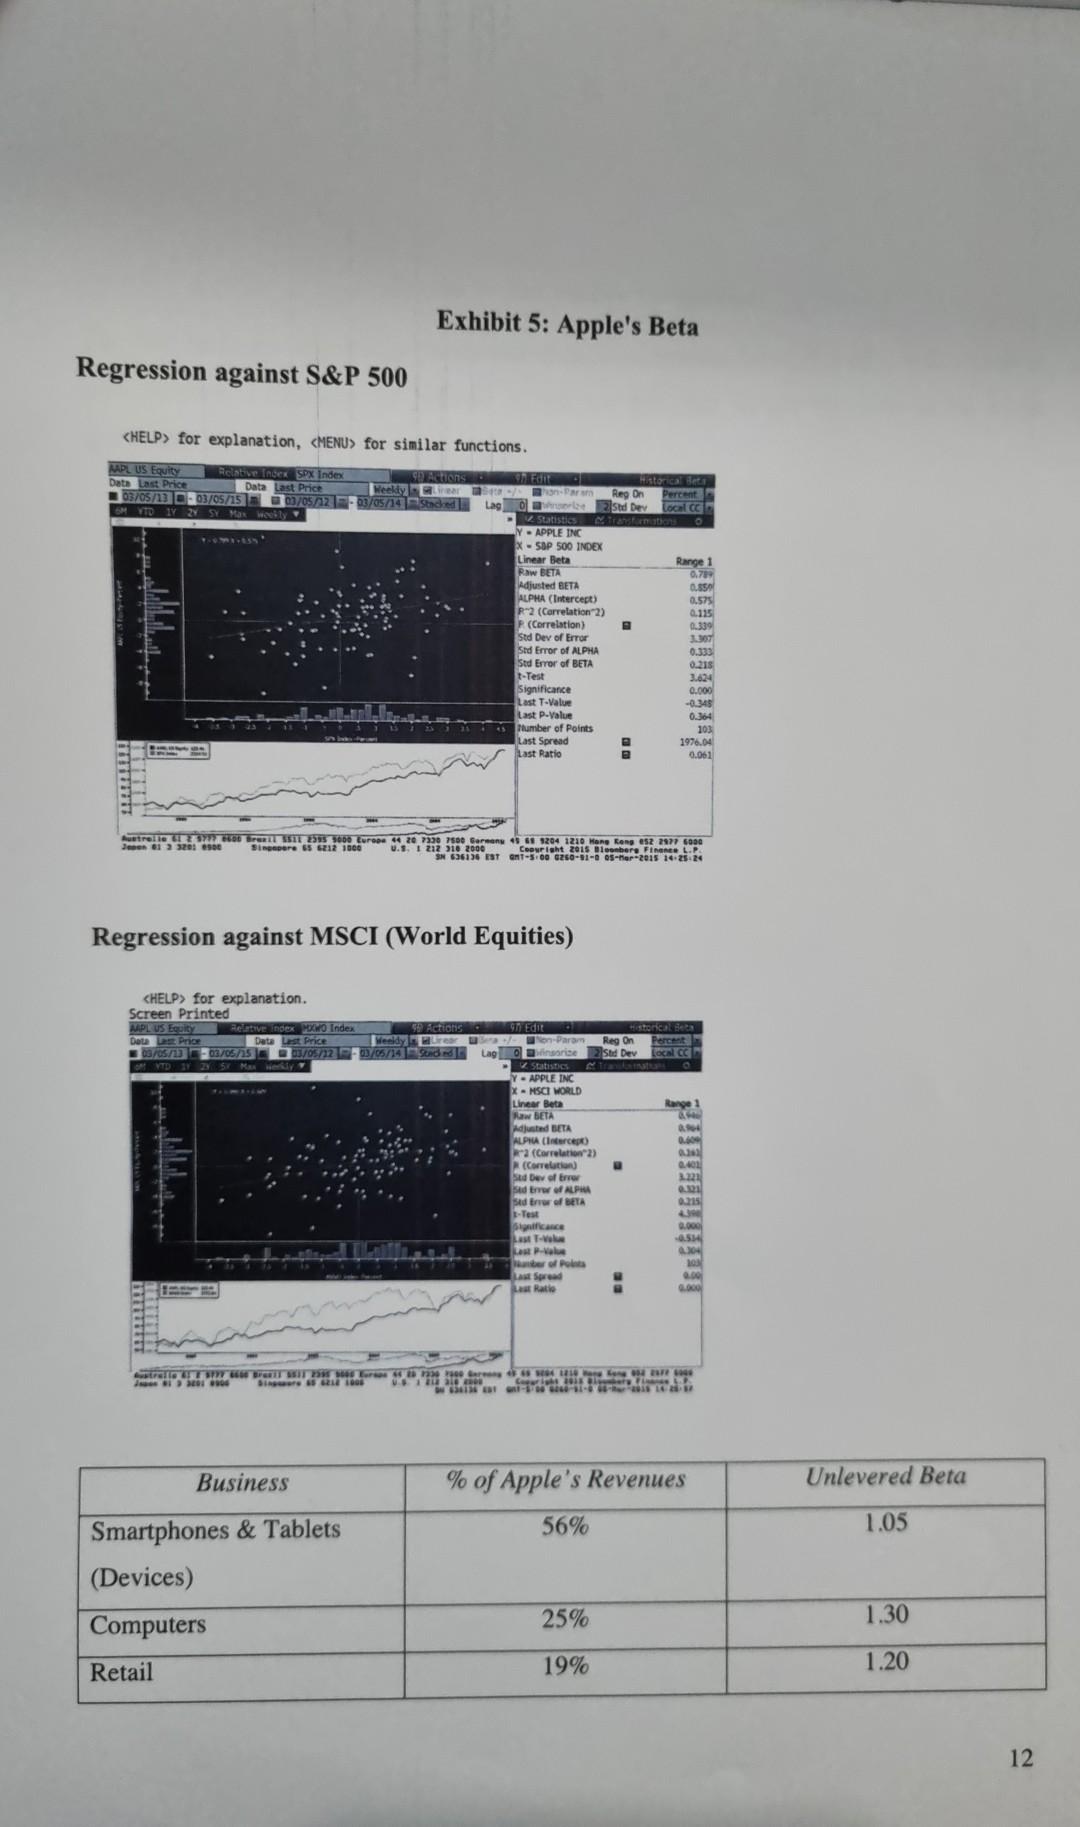
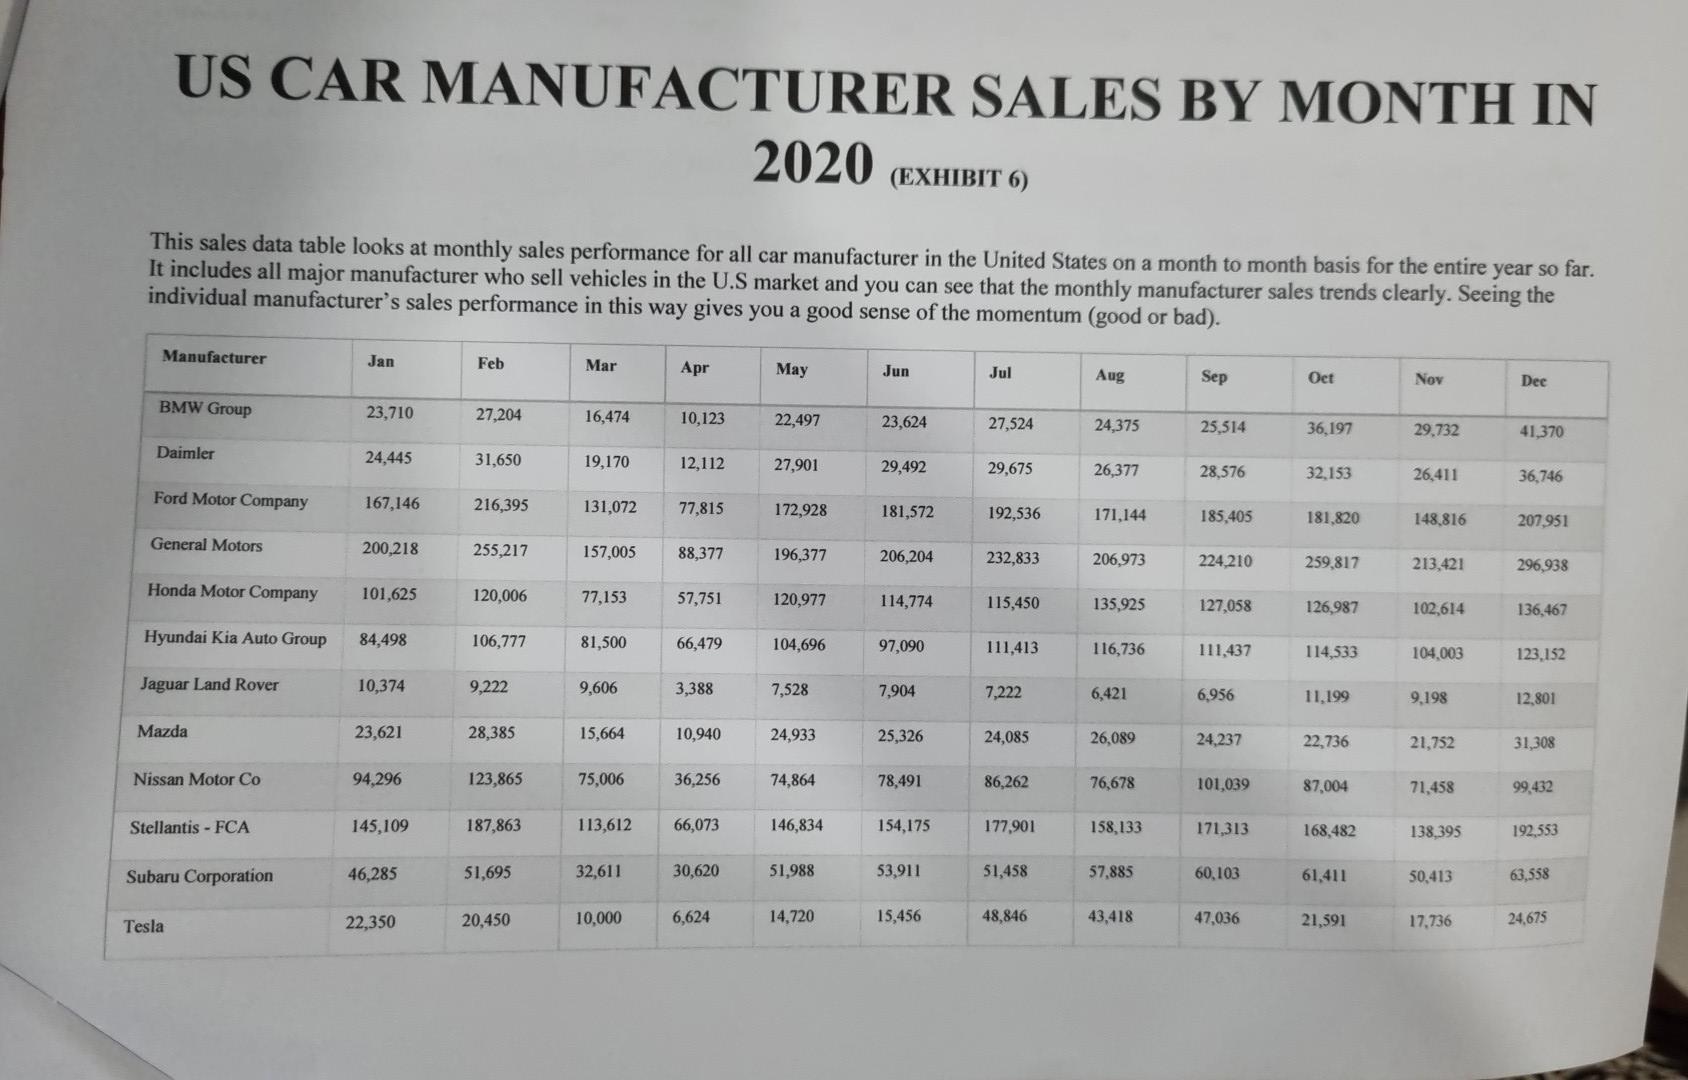
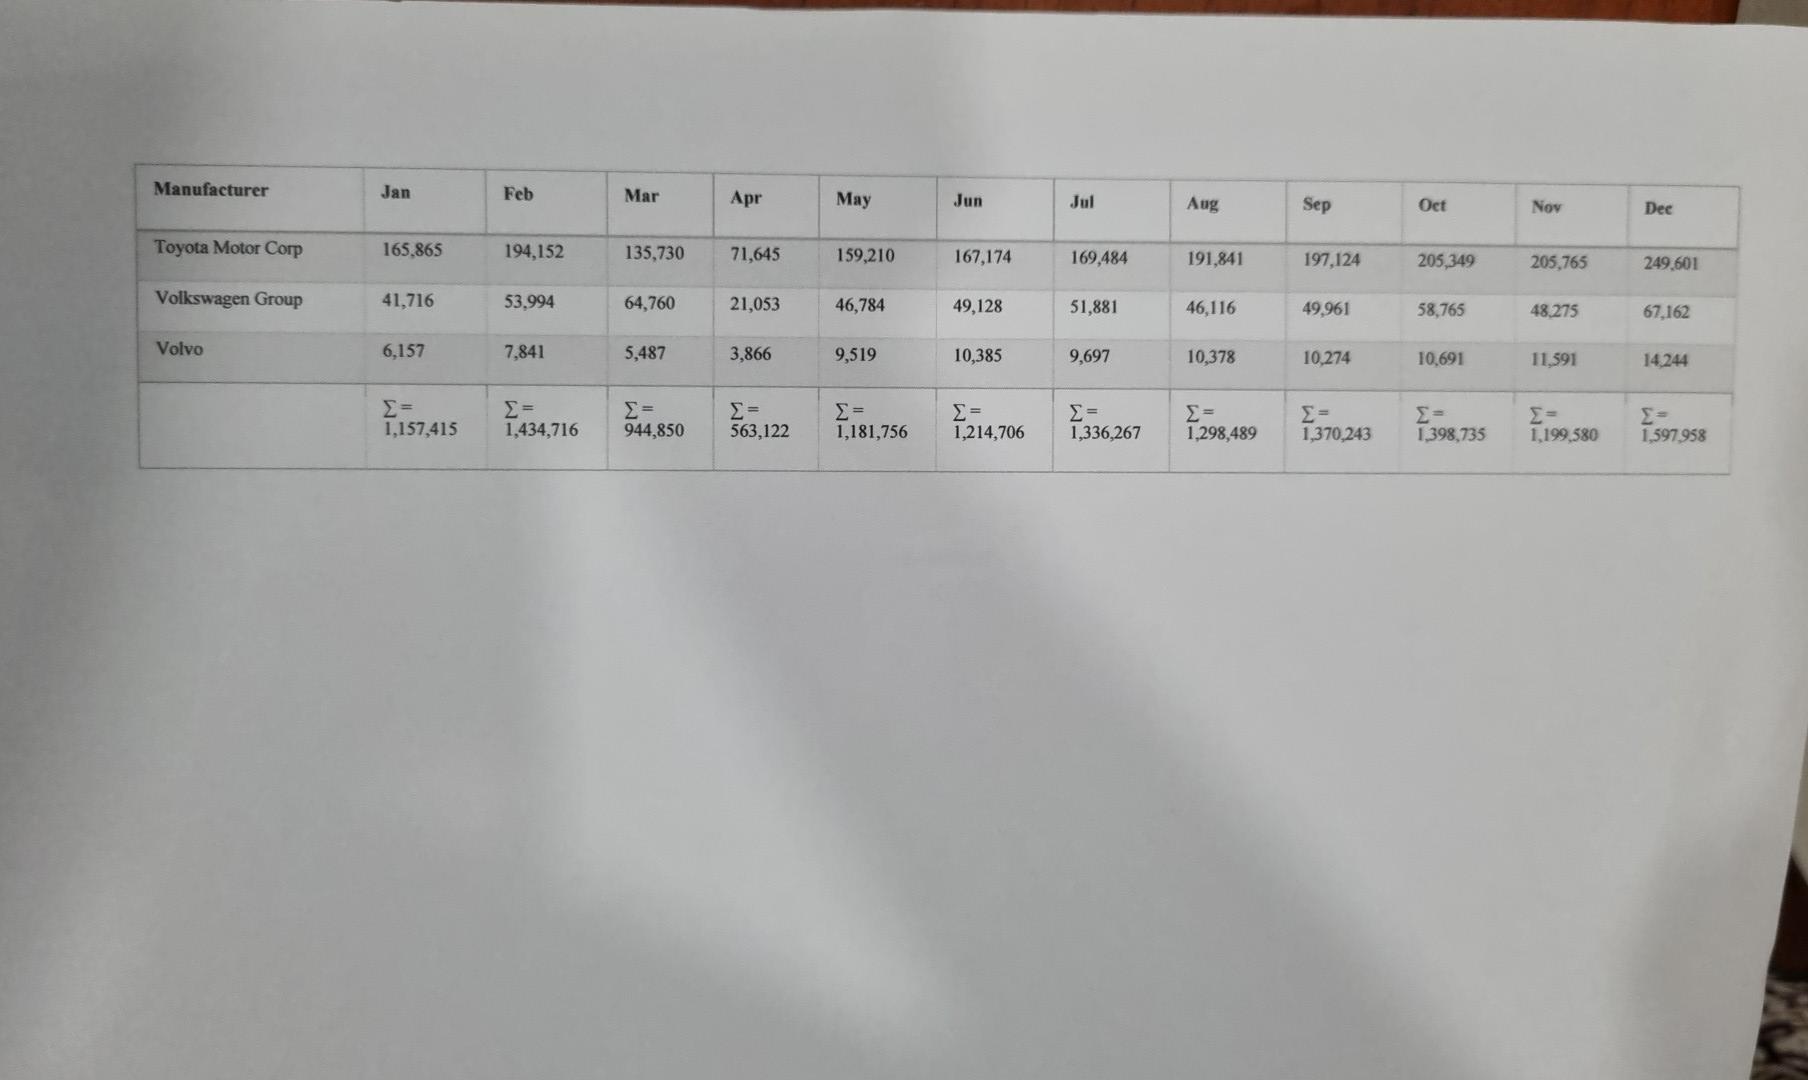
An Investment Analysis Case Study This case is a group project that is due on April 1, before class at 10.30. Stating the obvious: Each group will turn in one report (sounds obvious, but might as well make it explicit) electronically (as a pdf file). While you should include your flows tables in your report, you don't have to attach your excel spreadsheets. Cover page: Each report should have a cover page that contains following - the cash names of the group members in alphabetical order and the following summary information on the analysis: Decision on Investment: Invest or Do not invest Cost of capital: % value Return on capital: % value NPV - 10-year life: $ value NPV- Longer life: $ value Report format: Please try to keep your report brief. In the report, be clear about: a. Any assumptions you made to get to your conclusion b. Your final recommendation Exhibits: Please make sure that you include the following in your exhibits a. The table of earnings/cash flows by year b. Your computation of cost of equity/capital/discount rate Time: To keep time straight, you can assume the following: Next year: Year 1 Most recent year: Just ended Right now: Time 0. Any "up front" expenditure is incurred immediately. 1 Apple Disrupts the Auto Market: The Apple iCar? The Setting Apple Inc. has had a very good run, both in terms of earnings and stock prices, over the last decade. Based largely on the success of the iPod, the iPhone and the iPad, the company has reported double digit growth in revenues and earnings over the last few years (see exhibit 1) and its stock price has reflected this success (see exhibit 2). It has a substantial cash balance and a strong balance sheet (see exhibit 3 for balance sheet information). However, Tim Cook, CEO of Apple, is concerned that the halcyon days of the iPhone are coming to an end and is under pressure from financial markets to come up a new product in a big market. The Proposal Apple is considering entering the automobile market with an innovatively designed electric car, called the iCar, aimed at the premium end of the automobile market. You have been asked to collect the data to make the assessment and have come back with the following information: 1. R&D Expenses: Apple has already spent (and expensed) $ 5 billion on research on the automotive technology and development of the commercial design. None of that money can be recouped at this stage, if Apple decides not to go ahead with the iCar. 2. Introductory Costs; If Apple decides to go ahead with the iCar investment, it will have to spend $22 billion up front (right now) to lock in suppliers, distributors and retailers and to invest in infrastructure. The cost is depreciable over the next 10 years, down to a salvage value of $ 2 billion, and Apple expects to use straight-line depreciation 3, Market Potential and Share: In the premium auto market (including all cars priced at or above $60,000) there were 5 million automobiles sold globally in the most recent year and the market is expected to grow approximately 4% a year for the next decade. Apple expects to gain a 2% market share next year if the iCar is introduced and increase that market share by 2% a year (4% in the second year, 6% in the third year, 8% in the fourth year and 10% in year 5) to reach a target market share of 10% of the overall market by the fifth year. It expects to maintain that market share beyond year 6. 2 4. Pricing and Unit Costs: Apple expects to price its cars at $ 75,000 a unit next year and the price will keep pace with inflation after that. Based upon the costs of the the materials used in the iCar currently, Apple expects the production cost per unit to be $ 50,000 next year and grow at the inflation rate thereafter. 5. Marketing Options and Costs: Apple plans to use two different retailing options. In the first, it will sell the iCar through auto retailers and pay the retailers a commission of 10% of the price per unit sold (The retailers will have to follow Apple's fixed price schedule - no discounting allowed). In the second, it will sell the iCar through the Apple Auto Stores around the country. To do the latter, Apple will have to spend $5 billion right now in creating the stores; this expense will be depreciated straight line over the next 10 years to a salvage value of zero. It will also pay its sales people a commission of 5% of the price per unit for every car sold at an Apple Auto store. Apple expects to generate 80% of its revenues from specialty retailers and 20% from Apple Auto Store sales each year for the next 10 years. 6. Geographical breakdown: Apple expects to get its revenues from the iCar globally, with the following breakdown for revenues: Region % of Revenues Africa 2.00% Asia 30.00% Australia & New Zealand 8.00% Central and South America 10.00% Eastern Europe & Russia 5.00% Middle East 5.00% North America 25.00% Western Europe 15.00% Apple expects this revenue breakdown for the iCar to be stable over time. The regional country risk premiums (over and above the mature market premium) are provided in exhibit 4. You can assume that the premium for mature markets (Aaa rated countries) is 5.75%. 7. Production Facilities and Costs: Apple currently uses a manufacturing facility in Singapore to make batteries for its devices (iPhone, iPod and iPad). Apple used only 40% of the facility in the most recent year but the device market is expected to grow 12% a year for the next 10 years. If Apple goes ahead with the iCar, it will use the excess capacity to produce batteries for the iCar, with every 10,000 iCar batteries 3 using 1% of the capacity. (Thus, in a given year, if 200,000 iCars are produced, it will take up 20% of the total capacity of the battery factory). If the capacity limit is reached, Apple will have to invest a substantial amount to create a new facility of equivalent capacity. The current estimate of the cost of building a new facility is $ 5 billion, but this cost will grow at the inflation rate. 8. G&A expenses: Apple will allocate 10% of its existing general and administrative costs to the new division. These costs total $ 7.5 billion for the entire firm in the most recent year and are expected to grow 5% a year for the next 10 years, with or without the iCar investment. In addition, it is expected that Apple will have an increase of $ 0.5 billion in general and administrative costs next year when Apple iCar is introduced, and this amount will grow with the new division's dollar revenues after that. The latter cost is directly related to the new iCar division. 9. Advertising Expenses: Apple spent $ 8 billion on advertising in the most recent year. If Apple does not invest in the iCar, it expects this cost to increase 5% a year for the next 10 years. If the iCar is introduced, the total advertising expenses each year, from years 1 to 10, are expected to be 15% higher than they would have been without the iCar division. 10. Working Capital: The iCar will create working capital needs, which you have estimated as follows: . The sale of iCars to retailers will create accounts receivable amounting to 5% of revenues each year. Inventory (of both the input material and finished iCars) will be approximately 10% of the variable production cost (not including depreciation, marketing costs, allocations or advertising expenses). Accounts payable will be 6% of the variable production cost (not including depreciation, marketing costs, allocations or advertising expenses). All of these working capital investments will have to be made at the beginning of each year in which goods are sold. Thus, the working capital investment for the first year will have to be made at the beginning of the first year. 11. Side benefits for device sales: If Apple goes ahead with the Apple iCar, it will see revenues for the iPhone and iPad increase by $2 billion next year (as they are 4 integrated into the iCar), and grow at the inflation rate after that. The after-tax operating margin (after tax operating income/ revenues) is 40% for all Apple devices (iPads and iPhones). 12. Risk Measures: The beta for Apple is 0.79, calculated using weekly returns over the last 2 years and against the S&P 500 Index and 0.95 against the MSCI Global Index(see exhibit 5). Apple currently gets about 56% of its revenues from smartphones/tablets, 25% from computers and 19% from retail. The details of the beta calculation are included in Exhibit 5, as well as bottom up beta estimates for each of the three businesses of Apple. The current stock price for the firm is $ 128.85/share and there are 5,824.5 million shares outstanding. 13. Debt Choices: Apple expects to finance the iCar division using the same mix of debt and equity (in market value terms) as it is using currently in the rest of its business. Apple's currently has $36.4 billion in book value of interest bearing debt (with a weighted average maturity of 5 years) and it reports the following lease commitments for the future: Year Lease commitment 2015 $ 662 million 2016 $ 676 million 2017 $ 645 million 2018 $ 593 million 2019 $ 534 million Beyond $ 1,877 million The lease payment for the most recent year is $717 million. Apple was rated AA+ and the default spread for companies with that rating is 0.50%. 14. Taxes: Apple's effective tax rate is 26%, but its marginal tax rate is 40%. 15. Macro data: The current long-term US Treasury bond rate is 2.0%, and the expected inflation rate is 1.5%. 16. Other information: You have collected information on other automobile companies in Exhibit 6. The data includes the regression betas of these companies and relevant information on both market values of debt, equity and cash. You can assume a 40% 5 marginal tax rate for these firms, as well. (You can also assume that the debt includes the present value of operating leases). 6 Questions on the Project 1. Accounting Return Analysis . Estimate the operating income from the proposed iCar investment to Apple over the next 10 years. . Estimate the after-tax return on capital for the investment over the 10-year period. Based upon the after-tax return on capital, would you accept or reject this project? This will require you to make some assumptions about allocation and expensing. Make your assumptions as consistent as you can and estimate the return on capital. 2. Cash Flow Analysis . Estimate the after-tax incremental cash flows from the proposed iCar investment to Apple over the next 10 years. . If the project is terminated at the end of the 10th year, and both working capital and investment in other assets can be sold for book value at the end of that year, estimate the net present value of this project to Apple. Develop a net present value profile and estimate the internal rate of return for this project. . If the iCar division is expected to have a life much longer than 10 years, estimate the net present value of this project, making reasonable assumptions about investments needed and cash flows. Develop a net present value profile and estimate the internal rate of return for this project. 3. Sensitivity Analysis Estimate the sensitivity of your numbers to changes in at least three of the key assumptions underlying the analysis (You get to pick what you think are the three key assumptions), Based upon your analysis, and any other considerations you might have, tell me whether you would accept this project or reject it. Explain, briefly, your decision. 7 Exhibit 1: Apple's Income Statements in millions) Income Statement LTM LLC 12 months Sep-25- 2010 12 months Sep-24- 2011 For the Fiscal Period Ending Currency 12 months Sep-29- 2012 USD 12 months Sep-28- 2013 USD 12 months Sep-27- 2014 USD 12 months Dec-27- 2014 USD USD USD 65,225.0 108,249.0 156,508.0 170,910.0 182,795.0 199,800.0 Revenue Other Revenue Total Revenue 65,225.0 108,249.0 156,508.0 170,910.0 182,795.0 199,800.0 Cost Of Goods Sold Gross Profit 39,541.0 25,684.0 64,431.0 43,818.0 87,846.0 68,662.0 106,606.0 64,304.0 112,258.0 70,537.0 121,368.0 78,432.0 5,517.0 1,782.0 7,599.0 2,429.0 10,040.0 3,381.0 10,830.0 4,475.0 11,993.0 6,041.0 12,540.0 6.606.0 Selling General & Admin Exp. R & D Exp. Depreciation & Amort. Other Operating Expense/Income) Other Operating Exp., Total 7,299.0 10,028.0 13,421.0 15,305.0 18.034.0 19,146.0 Operating Income 18,385.0 33,790.0 55,241.0 48,999.0 52,503.0 59.286.0 Interest Expense Interest and Invest. Income Net Interest Exp. 311.0 311.0 519.0 519.0 1,088.0 1,088.0 (136.0) 1,616.0 1,480.0 (384.0) 1.795.0 1,411.0 (431.0) 2.022.0 1,591.0 Currency Exchange Gains (Loss) Other Non-Operating Inc. (Exp.) (156.0) 18,540.0 (104.0) 34,205.0 (658.0) 92.0 55,763.0 (301.0) (23.0) 50,155.0 (105.0) (121.0) 53,688.0 (115.0) (362.0) 60.400.0 EBT Excl. Unusual Items - (205.0) (210.0) Impairment of Goodwill Gain (Loss) On Sale Of Invest. Other Unusual Items EBT Incl. Unusual Items 18,540.0 34,205.0 55,763.0 50,155.0 53,483.0 60.190.0 Income Tax Expense Earnings from Cont. Ops. 4,527.0 14.013.0 8.283.0 25,922.0 14,030.0 41,733.0 13,118.0 37.037.0 13,973.0 39,510.0 15,728.0 44,462.0 Earnings of Discontinued Ops. Extraord. Item & Account Change Net Income to Company 14,013.0 25,922.0 41,733.0 37.037.0 39,510.0 44,462.0 Exhibit 2: Apple - Stock Prices 128.85 +2.44 (1.93%) s2 week 73.05 - 18.00 8-1 774 Real-time: 10:38AM EST NASDAQ-time data - Didier Currency in USD Range 127.49 - 129.37 Diviyield 0.4771.46 EPS 7.42 Open 128.40 Shares 5.82B Vol / Avg 24.40M/62.56M Bela 0.87 Mkt cap 750.44B Inst. own 61% P/E Dow Jones Nasdaq Technology AAPL 18,049.63 0.47% 4.980.58 0.04% 0.06% 128.85 1.93% 17.36 Compare: Enter tickar here Add Dow Jones Nasdaq SNDK MSFT SSNNF HPQ IBM VZ HTCKF Interval: 2min Smin 30min a weekly Apr 01, 2011 Feb 27, 2015 +7.24 (155.791) 130 petrolhealthy houl 384 446 444 440 47 470 D 0 US U 2011 2012 2013 2014 1985 1990 1995 2000 2005 2010 Settings Technicas e Link to this view Volume Exhibit 3: Apple's Balance Sheets Balance Sheet Sep-25- 2010 USD Sep-24- 2011 USD Sep-29- 2012 USD Sep-28- 2013 Sep-27- 2014 USD Dec-27- 2014 USD USD Balance Sheet as of: Currency ASSETS Cash And Equivalents Short Term Investments Trading Asset Securities Total Cash & ST Investments 11,261.0 14,359.0 9,815.0 16,137.0 10,746.0 18,383.0 14,259.0 26,287.0 44.0 40,590.0 13,844.0 11,233.0 81.0 25,158.0 19,478.0 12,985.0 201.0 32,664.0 25,620.0 25,952.0 29,129.0 Accounts Receivable Other Receivables Total Receivables 5,510.0 4,414.0 9,924.0 5,369.0 6,348.0 11.717.0 10,930.0 7,762.0 18,692.0 13,102.0 7,539.0 20,641.0 17,460.0 9,759.0 27,219.0 16,709.0 13,267.0 29,976.0 776.0 2,014.0 2,111.0 4,318.0 2.283.0 5,046.0 Inventory Deferred Tax Assets, Curr. Restricted Cash Other Current Assets Total Current Assets 1,051.0 1,636.0 445.0 3,002.0 41,678.0 791.0 2,583.0 278.0 6,180.0 57,653.0 1,764.0 3,453.0 164.0 6,674.0 73,286.0 4,529.0 44,988.0 9,725.0 68,531.0 13.434.0 83,403.0 Gross Property, Plant & Equipment Accumulated Depreciation Net Property, Plant & Equipment 7,234.0 (2,466.0) 4,768.0 11.768.0 (3,991.0) 7,777.0 21,887.0 (6,435.0) 15,452.0 28,519.0 (11,922.0) 16,597.0 39,015.0 (18,391.0) 20,624.0 40.747.0 (20,355.0) 20,392.0 Long-term Investments Goodwill Other Intangibles Other Long-Term Assets Total Assets 25,391.0 741.0 342.0 2,263.0 75.183.0 55,618.0 896.0 3,536.0 3,556.0 116,371.0 92,122.0 1,135.0 4,224.0 5,478.0 176,064.0 106,215.0 1,577.0 4,179.0 5,146.0 207.000.0 130,162.0 4.616.0 4,142.0 3,764.0 231.839.0 145,492.0 4,629.0 4,370.0 3.608.0 261.894.0 12,015.0 3,641.0 14,632.0 4,829.0 21,175.0 6,749.0 22,367.0 8,427.0 LIABILITIES Accounts Payable Accrued Exp. Short-term Borrowings Curr. Income Taxes Payable Unearned Revenue, Current Other Current Liabilities Total Current Liabilities 658.0 3,647.0 761.0 20,722.0 1,140.0 6,129.0 1,240.0 27,970.0 1,535.0 7,445.0 1,638.0 38,542.0 1.200.0 8,697.0 2,967.0 43,658.0 30.196.0 12,028.0 6,308.0 1,209.0 9.548.0 4,159.0 63,448.0 38.001.0 14,754.0 3,899.0 1,642.0 10.120.0 5.195.0 73,611.0 Long-Term Debt Unearned Revenue, Non-Current Def. Tax Liability, Non-Curr. Other Non-Current Liabilities Total Liabilities 1,139.0 4,300.0 1,231.0 27,392.0 1,686.0 8,159.0 1,941.0 39,756.0 2,648.0 13,847.0 2.817.0 57,854.0 16,960.0 2.625.0 16,489.0 3,719.0 83,451.0 28,987.0 3,031.0 20.259.0 4,567.0 120.292.0 32,504.0 3,480.0 23,371.0 5,600.0 138,566.0 10,668.0 13,331.0 16,422.0 19,764.0 23,313.0 24,187,0 37,169.0 62,841.0 101,289.0 104,256.0 87,152.0 Common Stock Additional Paid In Capital Retained Earnings Treasury Stock Comprehensive Inc. and Other Total Common Equity 97,178.0 (46.0) 47,791.0 443.0 76,615.0 499.0 118,210.0 (471.0) 123,549.0 1,082.0 111,547.0 1,963.0 123,328.0 Total Equity 47 791.0 76,615.0 118,210.0 123,549.0 111,547.0 123,328.0 Total Liabilities And Equity 75.183.0 116.371.0 176.064.0 207.000,0 231.839.0 261.894.0 10 Exhibit 4: Country Risk Premiums by region (over and above the mature market premium) Region Country Risk Premium (GDP Weighted Average) Africa 5.98% Asia 1.51% Australia & New Zealand 0.00% Central and South America 4.20% Eastern Europe & Russia 3.33% Middle East 1.10% North America 0.00% Western Europe 1.13% 11 Exhibit 5: Apple's Beta Regression against S&P 500 for explanation, for similar functions. UNITS MPL US Equity Relative Inc SPX Index Data Last Price Data Last Price westy 03/05 - 03/05/15 6/05/12 - 03/05/14 MTD IY 2V SY Han Webly Historical Beta Parm Reg Percent Lag Std Dev Local CC e statistics transformations - APPLE INC x - SOP 500 INDEX Linear Beta Range 1 Raw BETA 0.70 Adjusted BETA 0.550 ALPHA(Intercept) 0.575 P-2 (Correlation 2) 0.115 P (Correlation) 0.339 Std Dev of Error Std Error of ALPHA Std Error of BETA 0.218 t-Test 3.624 Significance 0.000 Last T-Value -0.345 Last P-value 0.364 RS Mumber of Points 103 Last Spread 1976.04 Last Ratio 0.061 trolley ruil 1511 353 5660 Europe 20 7330 7500 Garen 45 1204 1210 Wang Reng ez 2077 6000 en 612 320: es Singapore S 12 1000 U.S. I 212 316 2000 Copyright 2015 01 conhers Finance L.P SN 036136 EST T-5:00 G50-81-6 os-her-2015 14.25.24 Regression against MSCI (World Equities) for explanation. Screen Printed PLUS Equity Relative index MXWO Index Data est Price 03/05 - 03/05/15 03/05/12 01/05/12 -Param Percent LOCAL CC Lag Range 1 Reg on Dinaric Std Dev Statistics - APPLE INC X-MSCI WORLD Linear Beta Raw BETA Adjusted BETA ALPHA incerce) Ra (Correlation 2) (Correlation Sed Dev of Error Sedm of ALPHA Sad Enw of BETA 0.00 0.001 2221 12 0215 - 04 Le Tv Last Pole er of Poets Last Spread Lust Ratio estrell Wine 00 Brno Ben Burto JONG WE ALS WWE - Business % of Apple's Revenues Unlevered Beta Smartphones & Tablets 56% 1.05 (Devices) Computers 25% 1.30 Retail 19% 1.20 12 Exhibit 6: Automobile Companies The data includes all publicly traded automobile companies listed globally, with a market capitalization exceeding $1 billion. Click on this link to get the data in an excel spreadsheet. 13 US CAR MANUFACTURER SALES BY MONTH IN 2020 (EXHIBIT 6) This sales data table looks at monthly sales performance for all car manufacturer in the United States on a month to month basis for the entire year so far. It includes all major manufacturer who sell vehicles in the U.S market and you can see that the monthly manufacturer sales trends clearly. Seeing the individual manufacturer's sales performance in this way gives you a good sense of the momentum (good or bad). Manufacturer Jan Feb Mar Apr May Jun Jul Aug Sep Oet Nov Dee BMW Group 23,710 27,204 16,474 10,123 22,497 23,624 27,524 24,375 25,514 36,197 29,732 41,370 Daimler 24,445 31,650 19,170 12,112 27,901 29,492 29,675 26,377 28,576 32.153 26,411 36,746 Ford Motor Company 167,146 216,395 131,072 77,815 172,928 181,572 192,536 171,144 185,405 181,820 148,816 207951 General Motors 200,218 255,217 157,005 88,377 196,377 206,204 232,833 206,973 224.210 259,817 213,421 296,938 Honda Motor Company 101,625 120,006 77,153 57,751 120,977 114,774 115,450 135,925 127,058 126,987 102,614 136,467 Hyundai Kia Auto Group 84,498 106,777 81,500 66,479 104,696 97,090 111,413 116,736 111,437 114,533 104,003 123,152 Jaguar Land Rover 10,374 9,222 9,606 3,388 7,528 7,904 7,222 6,421 6,956 11,199 9.198 12.801 Mazda 23,621 28,385 15,664 10,940 24,933 25,326 24,085 26,089 24,237 22,736 21,752 31,308 Nissan Motor Co 94,296 123,865 75,006 36,256 74,864 78,491 86,262 76,678 101,039 87,004 71,458 99,432 Stellantis - FCA 145,109 187,863 113,612 66,073 146,834 154,175 177,901 158,133 171,313 168,482 138,395 192,553 Subaru Corporation 46,285 51,695 32,611 30,620 51,988 53,911 51,458 57,885 60,103 61,411 50,413 63,558 22,350 20,450 10,000 6,624 14,720 15,456 48,846 Tesla 43,418 47,036 21,591 17,736 24,675 Manufacturer Jan Feb Mar Apr May Jun Aug Sep Oct Nov Dee Toyota Motor Corp 165,865 194,152 135,730 71,645 159,210 167,174 169,484 191,841 197,124 205,349 205,765 249,601 Volkswagen Group 41,716 53.994 64,760 21,053 46,784 49,128 51,881 46,116 49,961 58,765 48,275 67,162 Volvo 6.157 7,841 5,487 3,866 9,519 10,385 9,697 10,378 10,274 10,691 11,591 14.244 = 1,157,415 = 944,850 = 563,122 1,434,716 1,181,756 1,214,706 1,336,267 7,370.243 1,298,489 1,370,243 1.398,735 1.199,580 1,597,958 An Investment Analysis Case Study This case is a group project that is due on April 1, before class at 10.30. Stating the obvious: Each group will turn in one report (sounds obvious, but might as well make it explicit) electronically (as a pdf file). While you should include your flows tables in your report, you don't have to attach your excel spreadsheets. Cover page: Each report should have a cover page that contains following - the cash names of the group members in alphabetical order and the following summary information on the analysis: Decision on Investment: Invest or Do not invest Cost of capital: % value Return on capital: % value NPV - 10-year life: $ value NPV- Longer life: $ value Report format: Please try to keep your report brief. In the report, be clear about: a. Any assumptions you made to get to your conclusion b. Your final recommendation Exhibits: Please make sure that you include the following in your exhibits a. The table of earnings/cash flows by year b. Your computation of cost of equity/capital/discount rate Time: To keep time straight, you can assume the following: Next year: Year 1 Most recent year: Just ended Right now: Time 0. Any "up front" expenditure is incurred immediately. 1 Apple Disrupts the Auto Market: The Apple iCar? The Setting Apple Inc. has had a very good run, both in terms of earnings and stock prices, over the last decade. Based largely on the success of the iPod, the iPhone and the iPad, the company has reported double digit growth in revenues and earnings over the last few years (see exhibit 1) and its stock price has reflected this success (see exhibit 2). It has a substantial cash balance and a strong balance sheet (see exhibit 3 for balance sheet information). However, Tim Cook, CEO of Apple, is concerned that the halcyon days of the iPhone are coming to an end and is under pressure from financial markets to come up a new product in a big market. The Proposal Apple is considering entering the automobile market with an innovatively designed electric car, called the iCar, aimed at the premium end of the automobile market. You have been asked to collect the data to make the assessment and have come back with the following information: 1. R&D Expenses: Apple has already spent (and expensed) $ 5 billion on research on the automotive technology and development of the commercial design. None of that money can be recouped at this stage, if Apple decides not to go ahead with the iCar. 2. Introductory Costs; If Apple decides to go ahead with the iCar investment, it will have to spend $22 billion up front (right now) to lock in suppliers, distributors and retailers and to invest in infrastructure. The cost is depreciable over the next 10 years, down to a salvage value of $ 2 billion, and Apple expects to use straight-line depreciation 3, Market Potential and Share: In the premium auto market (including all cars priced at or above $60,000) there were 5 million automobiles sold globally in the most recent year and the market is expected to grow approximately 4% a year for the next decade. Apple expects to gain a 2% market share next year if the iCar is introduced and increase that market share by 2% a year (4% in the second year, 6% in the third year, 8% in the fourth year and 10% in year 5) to reach a target market share of 10% of the overall market by the fifth year. It expects to maintain that market share beyond year 6. 2 4. Pricing and Unit Costs: Apple expects to price its cars at $ 75,000 a unit next year and the price will keep pace with inflation after that. Based upon the costs of the the materials used in the iCar currently, Apple expects the production cost per unit to be $ 50,000 next year and grow at the inflation rate thereafter. 5. Marketing Options and Costs: Apple plans to use two different retailing options. In the first, it will sell the iCar through auto retailers and pay the retailers a commission of 10% of the price per unit sold (The retailers will have to follow Apple's fixed price schedule - no discounting allowed). In the second, it will sell the iCar through the Apple Auto Stores around the country. To do the latter, Apple will have to spend $5 billion right now in creating the stores; this expense will be depreciated straight line over the next 10 years to a salvage value of zero. It will also pay its sales people a commission of 5% of the price per unit for every car sold at an Apple Auto store. Apple expects to generate 80% of its revenues from specialty retailers and 20% from Apple Auto Store sales each year for the next 10 years. 6. Geographical breakdown: Apple expects to get its revenues from the iCar globally, with the following breakdown for revenues: Region % of Revenues Africa 2.00% Asia 30.00% Australia & New Zealand 8.00% Central and South America 10.00% Eastern Europe & Russia 5.00% Middle East 5.00% North America 25.00% Western Europe 15.00% Apple expects this revenue breakdown for the iCar to be stable over time. The regional country risk premiums (over and above the mature market premium) are provided in exhibit 4. You can assume that the premium for mature markets (Aaa rated countries) is 5.75%. 7. Production Facilities and Costs: Apple currently uses a manufacturing facility in Singapore to make batteries for its devices (iPhone, iPod and iPad). Apple used only 40% of the facility in the most recent year but the device market is expected to grow 12% a year for the next 10 years. If Apple goes ahead with the iCar, it will use the excess capacity to produce batteries for the iCar, with every 10,000 iCar batteries 3 using 1% of the capacity. (Thus, in a given year, if 200,000 iCars are produced, it will take up 20% of the total capacity of the battery factory). If the capacity limit is reached, Apple will have to invest a substantial amount to create a new facility of equivalent capacity. The current estimate of the cost of building a new facility is $ 5 billion, but this cost will grow at the inflation rate. 8. G&A expenses: Apple will allocate 10% of its existing general and administrative costs to the new division. These costs total $ 7.5 billion for the entire firm in the most recent year and are expected to grow 5% a year for the next 10 years, with or without the iCar investment. In addition, it is expected that Apple will have an increase of $ 0.5 billion in general and administrative costs next year when Apple iCar is introduced, and this amount will grow with the new division's dollar revenues after that. The latter cost is directly related to the new iCar division. 9. Advertising Expenses: Apple spent $ 8 billion on advertising in the most recent year. If Apple does not invest in the iCar, it expects this cost to increase 5% a year for the next 10 years. If the iCar is introduced, the total advertising expenses each year, from years 1 to 10, are expected to be 15% higher than they would have been without the iCar division. 10. Working Capital: The iCar will create working capital needs, which you have estimated as follows: . The sale of iCars to retailers will create accounts receivable amounting to 5% of revenues each year. Inventory (of both the input material and finished iCars) will be approximately 10% of the variable production cost (not including depreciation, marketing costs, allocations or advertising expenses). Accounts payable will be 6% of the variable production cost (not including depreciation, marketing costs, allocations or advertising expenses). All of these working capital investments will have to be made at the beginning of each year in which goods are sold. Thus, the working capital investment for the first year will have to be made at the beginning of the first year. 11. Side benefits for device sales: If Apple goes ahead with the Apple iCar, it will see revenues for the iPhone and iPad increase by $2 billion next year (as they are 4 integrated into the iCar), and grow at the inflation rate after that. The after-tax operating margin (after tax operating income/ revenues) is 40% for all Apple devices (iPads and iPhones). 12. Risk Measures: The beta for Apple is 0.79, calculated using weekly returns over the last 2 years and against the S&P 500 Index and 0.95 against the MSCI Global Index(see exhibit 5). Apple currently gets about 56% of its revenues from smartphones/tablets, 25% from computers and 19% from retail. The details of the beta calculation are included in Exhibit 5, as well as bottom up beta estimates for each of the three businesses of Apple. The current stock price for the firm is $ 128.85/share and there are 5,824.5 million shares outstanding. 13. Debt Choices: Apple expects to finance the iCar division using the same mix of debt and equity (in market value terms) as it is using currently in the rest of its business. Apple's currently has $36.4 billion in book value of interest bearing debt (with a weighted average maturity of 5 years) and it reports the following lease commitments for the future: Year Lease commitment 2015 $ 662 million 2016 $ 676 million 2017 $ 645 million 2018 $ 593 million 2019 $ 534 million Beyond $ 1,877 million The lease payment for the most recent year is $717 million. Apple was rated AA+ and the default spread for companies with that rating is 0.50%. 14. Taxes: Apple's effective tax rate is 26%, but its marginal tax rate is 40%. 15. Macro data: The current long-term US Treasury bond rate is 2.0%, and the expected inflation rate is 1.5%. 16. Other information: You have collected information on other automobile companies in Exhibit 6. The data includes the regression betas of these companies and relevant information on both market values of debt, equity and cash. You can assume a 40% 5 marginal tax rate for these firms, as well. (You can also assume that the debt includes the present value of operating leases). 6 Questions on the Project 1. Accounting Return Analysis . Estimate the operating income from the proposed iCar investment to Apple over the next 10 years. . Estimate the after-tax return on capital for the investment over the 10-year period. Based upon the after-tax return on capital, would you accept or reject this project? This will require you to make some assumptions about allocation and expensing. Make your assumptions as consistent as you can and estimate the return on capital. 2. Cash Flow Analysis . Estimate the after-tax incremental cash flows from the proposed iCar investment to Apple over the next 10 years. . If the project is terminated at the end of the 10th year, and both working capital and investment in other assets can be sold for book value at the end of that year, estimate the net present value of this project to Apple. Develop a net present value profile and estimate the internal rate of return for this project. . If the iCar division is expected to have a life much longer than 10 years, estimate the net present value of this project, making reasonable assumptions about investments needed and cash flows. Develop a net present value profile and estimate the internal rate of return for this project. 3. Sensitivity Analysis Estimate the sensitivity of your numbers to changes in at least three of the key assumptions underlying the analysis (You get to pick what you think are the three key assumptions), Based upon your analysis, and any other considerations you might have, tell me whether you would accept this project or reject it. Explain, briefly, your decision. 7 Exhibit 1: Apple's Income Statements in millions) Income Statement LTM LLC 12 months Sep-25- 2010 12 months Sep-24- 2011 For the Fiscal Period Ending Currency 12 months Sep-29- 2012 USD 12 months Sep-28- 2013 USD 12 months Sep-27- 2014 USD 12 months Dec-27- 2014 USD USD USD 65,225.0 108,249.0 156,508.0 170,910.0 182,795.0 199,800.0 Revenue Other Revenue Total Revenue 65,225.0 108,249.0 156,508.0 170,910.0 182,795.0 199,800.0 Cost Of Goods Sold Gross Profit 39,541.0 25,684.0 64,431.0 43,818.0 87,846.0 68,662.0 106,606.0 64,304.0 112,258.0 70,537.0 121,368.0 78,432.0 5,517.0 1,782.0 7,599.0 2,429.0 10,040.0 3,381.0 10,830.0 4,475.0 11,993.0 6,041.0 12,540.0 6.606.0 Selling General & Admin Exp. R & D Exp. Depreciation & Amort. Other Operating Expense/Income) Other Operating Exp., Total 7,299.0 10,028.0 13,421.0 15,305.0 18.034.0 19,146.0 Operating Income 18,385.0 33,790.0 55,241.0 48,999.0 52,503.0 59.286.0 Interest Expense Interest and Invest. Income Net Interest Exp. 311.0 311.0 519.0 519.0 1,088.0 1,088.0 (136.0) 1,616.0 1,480.0 (384.0) 1.795.0 1,411.0 (431.0) 2.022.0 1,591.0 Currency Exchange Gains (Loss) Other Non-Operating Inc. (Exp.) (156.0) 18,540.0 (104.0) 34,205.0 (658.0) 92.0 55,763.0 (301.0) (23.0) 50,155.0 (105.0) (121.0) 53,688.0 (115.0) (362.0) 60.400.0 EBT Excl. Unusual Items - (205.0) (210.0) Impairment of Goodwill Gain (Loss) On Sale Of Invest. Other Unusual Items EBT Incl. Unusual Items 18,540.0 34,205.0 55,763.0 50,155.0 53,483.0 60.190.0 Income Tax Expense Earnings from Cont. Ops. 4,527.0 14.013.0 8.283.0 25,922.0 14,030.0 41,733.0 13,118.0 37.037.0 13,973.0 39,510.0 15,728.0 44,462.0 Earnings of Discontinued Ops. Extraord. Item & Account Change Net Income to Company 14,013.0 25,922.0 41,733.0 37.037.0 39,510.0 44,462.0 Exhibit 2: Apple - Stock Prices 128.85 +2.44 (1.93%) s2 week 73.05 - 18.00 8-1 774 Real-time: 10:38AM EST NASDAQ-time data - Didier Currency in USD Range 127.49 - 129.37 Diviyield 0.4771.46 EPS 7.42 Open 128.40 Shares 5.82B Vol / Avg 24.40M/62.56M Bela 0.87 Mkt cap 750.44B Inst. own 61% P/E Dow Jones Nasdaq Technology AAPL 18,049.63 0.47% 4.980.58 0.04% 0.06% 128.85 1.93% 17.36 Compare: Enter tickar here Add Dow Jones Nasdaq SNDK MSFT SSNNF HPQ IBM VZ HTCKF Interval: 2min Smin 30min a weekly Apr 01, 2011 Feb 27, 2015 +7.24 (155.791) 130 petrolhealthy houl 384 446 444 440 47 470 D 0 US U 2011 2012 2013 2014 1985 1990 1995 2000 2005 2010 Settings Technicas e Link to this view Volume Exhibit 3: Apple's Balance Sheets Balance Sheet Sep-25- 2010 USD Sep-24- 2011 USD Sep-29- 2012 USD Sep-28- 2013 Sep-27- 2014 USD Dec-27- 2014 USD USD Balance Sheet as of: Currency ASSETS Cash And Equivalents Short Term Investments Trading Asset Securities Total Cash & ST Investments 11,261.0 14,359.0 9,815.0 16,137.0 10,746.0 18,383.0 14,259.0 26,287.0 44.0 40,590.0 13,844.0 11,233.0 81.0 25,158.0 19,478.0 12,985.0 201.0 32,664.0 25,620.0 25,952.0 29,129.0 Accounts Receivable Other Receivables Total Receivables 5,510.0 4,414.0 9,924.0 5,369.0 6,348.0 11.717.0 10,930.0 7,762.0 18,692.0 13,102.0 7,539.0 20,641.0 17,460.0 9,759.0 27,219.0 16,709.0 13,267.0 29,976.0 776.0 2,014.0 2,111.0 4,318.0 2.283.0 5,046.0 Inventory Deferred Tax Assets, Curr. Restricted Cash Other Current Assets Total Current Assets 1,051.0 1,636.0 445.0 3,002.0 41,678.0 791.0 2,583.0 278.0 6,180.0 57,653.0 1,764.0 3,453.0 164.0 6,674.0 73,286.0 4,529.0 44,988.0 9,725.0 68,531.0 13.434.0 83,403.0 Gross Property, Plant & Equipment Accumulated Depreciation Net Property, Plant & Equipment 7,234.0 (2,466.0) 4,768.0 11.768.0 (3,991.0) 7,777.0 21,887.0 (6,435.0) 15,452.0 28,519.0 (11,922.0) 16,597.0 39,015.0 (18,391.0) 20,624.0 40.747.0 (20,355.0) 20,392.0 Long-term Investments Goodwill Other Intangibles Other Long-Term Assets Total Assets 25,391.0 741.0 342.0 2,263.0 75.183.0 55,618.0 896.0 3,536.0 3,556.0 116,371.0 92,122.0 1,135.0 4,224.0 5,478.0 176,064.0 106,215.0 1,577.0 4,179.0 5,146.0 207.000.0 130,162.0 4.616.0 4,142.0 3,764.0 231.839.0 145,492.0 4,629.0 4,370.0 3.608.0 261.894.0 12,015.0 3,641.0 14,632.0 4,829.0 21,175.0 6,749.0 22,367.0 8,427.0 LIABILITIES Accounts Payable Accrued Exp. Short-term Borrowings Curr. Income Taxes Payable Unearned Revenue, Current Other Current Liabilities Total Current Liabilities 658.0 3,647.0 761.0 20,722.0 1,140.0 6,129.0 1,240.0 27,970.0 1,535.0 7,445.0 1,638.0 38,542.0 1.200.0 8,697.0 2,967.0 43,658.0 30.196.0 12,028.0 6,308.0 1,209.0 9.548.0 4,159.0 63,448.0 38.001.0 14,754.0 3,899.0 1,642.0 10.120.0 5.195.0 73,611.0 Long-Term Debt Unearned Revenue, Non-Current Def. Tax Liability, Non-Curr. Other Non-Current Liabilities Total Liabilities 1,139.0 4,300.0 1,231.0 27,392.0 1,686.0 8,159.0 1,941.0 39,756.0 2,648.0 13,847.0 2.817.0 57,854.0 16,960.0 2.625.0 16,489.0 3,719.0 83,451.0 28,987.0 3,031.0 20.259.0 4,567.0 120.292.0 32,504.0 3,480.0 23,371.0 5,600.0 138,566.0 10,668.0 13,331.0 16,422.0 19,764.0 23,313.0 24,187,0 37,169.0 62,841.0 101,289.0 104,256.0 87,152.0 Common Stock Additional Paid In Capital Retained Earnings Treasury Stock Comprehensive Inc. and Other Total Common Equity 97,178.0 (46.0) 47,791.0 443.0 76,615.0 499.0 118,210.0 (471.0) 123,549.0 1,082.0 111,547.0 1,963.0 123,328.0 Total Equity 47 791.0 76,615.0 118,210.0 123,549.0 111,547.0 123,328.0 Total Liabilities And Equity 75.183.0 116.371.0 176.064.0 207.000,0 231.839.0 261.894.0 10 Exhibit 4: Country Risk Premiums by region (over and above the mature market premium) Region Country Risk Premium (GDP Weighted Average) Africa 5.98% Asia 1.51% Australia & New Zealand 0.00% Central and South America 4.20% Eastern Europe & Russia 3.33% Middle East 1.10% North America 0.00% Western Europe 1.13% 11 Exhibit 5: Apple's Beta Regression against S&P 500 for explanation, for similar functions. UNITS MPL US Equity Relative Inc SPX Index Data Last Price Data Last Price westy 03/05 - 03/05/15 6/05/12 - 03/05/14 MTD IY 2V SY Han Webly Historical Beta Parm Reg Percent Lag Std Dev Local CC e statistics transformations - APPLE INC x - SOP 500 INDEX Linear Beta Range 1 Raw BETA 0.70 Adjusted BETA 0.550 ALPHA(Intercept) 0.575 P-2 (Correlation 2) 0.115 P (Correlation) 0.339 Std Dev of Error Std Error of ALPHA Std Error of BETA 0.218 t-Test 3.624 Significance 0.000 Last T-Value -0.345 Last P-value 0.364 RS Mumber of Points 103 Last Spread 1976.04 Last Ratio 0.061 trolley ruil 1511 353 5660 Europe 20 7330 7500 Garen 45 1204 1210 Wang Reng ez 2077 6000 en 612 320: es Singapore S 12 1000 U.S. I 212 316 2000 Copyright 2015 01 conhers Finance L.P SN 036136 EST T-5:00 G50-81-6 os-her-2015 14.25.24 Regression against MSCI (World Equities) for explanation. Screen Printed PLUS Equity Relative index MXWO Index Data est Price 03/05 - 03/05/15 03/05/12 01/05/12 -Param Percent LOCAL CC Lag Range 1 Reg on Dinaric Std Dev Statistics - APPLE INC X-MSCI WORLD Linear Beta Raw BETA Adjusted BETA ALPHA incerce) Ra (Correlation 2) (Correlation Sed Dev of Error Sedm of ALPHA Sad Enw of BETA 0.00 0.001 2221 12 0215 - 04 Le Tv Last Pole er of Poets Last Spread Lust Ratio estrell Wine 00 Brno Ben Burto JONG WE ALS WWE - Business % of Apple's Revenues Unlevered Beta Smartphones & Tablets 56% 1.05 (Devices) Computers 25% 1.30 Retail 19% 1.20 12 Exhibit 6: Automobile Companies The data includes all publicly traded automobile companies listed globally, with a market capitalization exceeding $1 billion. Click on this link to get the data in an excel spreadsheet. 13 US CAR MANUFACTURER SALES BY MONTH IN 2020 (EXHIBIT 6) This sales data table looks at monthly sales performance for all car manufacturer in the United States on a month to month basis for the entire year so far. It includes all major manufacturer who sell vehicles in the U.S market and you can see that the monthly manufacturer sales trends clearly. Seeing the individual manufacturer's sales performance in this way gives you a good sense of the momentum (good or bad). Manufacturer Jan Feb Mar Apr May Jun Jul Aug Sep Oet Nov Dee BMW Group 23,710 27,204 16,474 10,123 22,497 23,624 27,524 24,375 25,514 36,197 29,732 41,370 Daimler 24,445 31,650 19,170 12,112 27,901 29,492 29,675 26,377 28,576 32.153 26,411 36,746 Ford Motor Company 167,146 216,395 131,072 77,815 172,928 181,572 192,536 171,144 185,405 181,820 148,816 207951 General Motors 200,218 255,217 157,005 88,377 196,377 206,204 232,833 206,973 224.210 259,817 213,421 296,938 Honda Motor Company 101,625 120,006 77,153 57,751 120,977 114,774 115,450 135,925 127,058 126,987 102,614 136,467 Hyundai Kia Auto Group 84,498 106,777 81,500 66,479 104,696 97,090 111,413 116,736 111,437 114,533 104,003 123,152 Jaguar Land Rover 10,374 9,222 9,606 3,388 7,528 7,904 7,222 6,421 6,956 11,199 9.198 12.801 Mazda 23,621 28,385 15,664 10,940 24,933 25,326 24,085 26,089 24,237 22,736 21,752 31,308 Nissan Motor Co 94,296 123,865 75,006 36,256 74,864 78,491 86,262 76,678 101,039 87,004 71,458 99,432 Stellantis - FCA 145,109 187,863 113,612 66,073 146,834 154,175 177,901 158,133 171,313 168,482 138,395 192,553 Subaru Corporation 46,285 51,695 32,611 30,620 51,988 53,911 51,458 57,885 60,103 61,411 50,413 63,558 22,350 20,450 10,000 6,624 14,720 15,456 48,846 Tesla 43,418 47,036 21,591 17,736 24,675 Manufacturer Jan Feb Mar Apr May Jun Aug Sep Oct Nov Dee Toyota Motor Corp 165,865 194,152 135,730 71,645 159,210 167,174 169,484 191,841 197,124 205,349 205,765 249,601 Volkswagen Group 41,716 53.994 64,760 21,053 46,784 49,128 51,881 46,116 49,961 58,765 48,275 67,162 Volvo 6.157 7,841 5,487 3,866 9,519 10,385 9,697 10,378 10,274 10,691 11,591 14.244 = 1,157,415 = 944,850 = 563,122 1,434,716 1,181,756 1,214,706 1,336,267 7,370.243 1,298,489 1,370,243 1.398,735 1.199,580 1,597,958

Step by Step Solution

There are 3 Steps involved in it

Step: 1

blur-text-image

Get Instant Access to Expert-Tailored Solutions

See step-by-step solutions with expert insights and AI powered tools for academic success

Step: 2

blur-text-image

Step: 3

blur-text-image

Ace Your Homework with AI

Get the answers you need in no time with our AI-driven, step-by-step assistance

Get Started

Recommended Textbook for

Amazon Goldmine How Amazon Can Make You A Millionaire

Authors: Mrs Esther B. Odejimi

1st Edition

1533513406, 978-1533513403

More Books

Students also viewed these Finance questions

Question

What is linear transformation? Define with example

Answered: 1 week ago