

Answered step by step
Verified Expert Solution
Question
1 Approved Answer
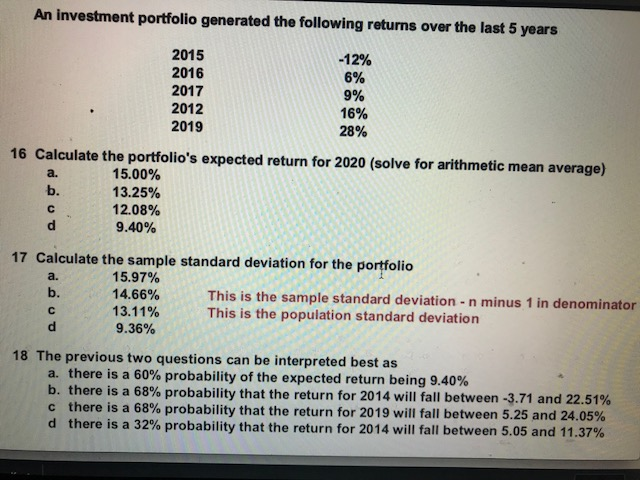
An investment portfolio generated the following returns over the last 5 years 2015 2016 2017 2012 2019 -12% 6% 9% 16% 28% 16 Calculate the
Step by Step Solution
There are 3 Steps involved in it
Step: 1

Get Instant Access to Expert-Tailored Solutions
See step-by-step solutions with expert insights and AI powered tools for academic success
Step: 2

Step: 3
Ace Your Homework with AI
Get the answers you need in no time with our AI-driven, step-by-step assistance
Get Started
Public Finance
Authors: Harvey Rosen
6th International Edition
0071121234, 978-0071121231