Question
An investor, David, is looking to sell shares currently in his portfolio, and has identified two potential companies shares he would be willing to sell.
An investor, David, is looking to sell shares currently in his portfolio, and has identified two potential companies shares he would be willing to sell. He notes that the fluctuations in share prices of both companies are normally distributed. The shares of the first company, which he labels Share A, have an average price of $0.60 and a standard deviation of $0.45. The shares of the second company, Share B, has an average price of $0.55 and a standard deviation of $0.5.
In Excel, navigate to the first tab labelled Practice area for Question 1. Here, you will find the normal distributions of the two share prices. Change the mean and standard deviation values (simply overwrite the values) to see how they influence the probability distributions. After getting a feel for this, navigate to the tab labelled Question 1.
David is looking to sell only one of the two companies shares, but is unsure which company has a higher probability of selling successfully at a certain price.
By entering a specific selling price in the spreadsheet, you can calculate the probability of the share selling for more than the input selling price. You will note that the default selling price is the mean price, and the probability is therefore 0.50 (since a normal distribution is symmetric about its mean).
Answer the following questions:
- If David was to define a selling price of $0.90, which share has a higher probability of selling for more than this price? What about a selling price of $1.20? Enter each selling price in the spreadsheet to calculate the probabilities. Explain what these values mean.
- Comment on what you think drives the difference in probabilities between a selling price of $0.90, and a selling price of $1.20.
- Which share do you think David should sell, and why?
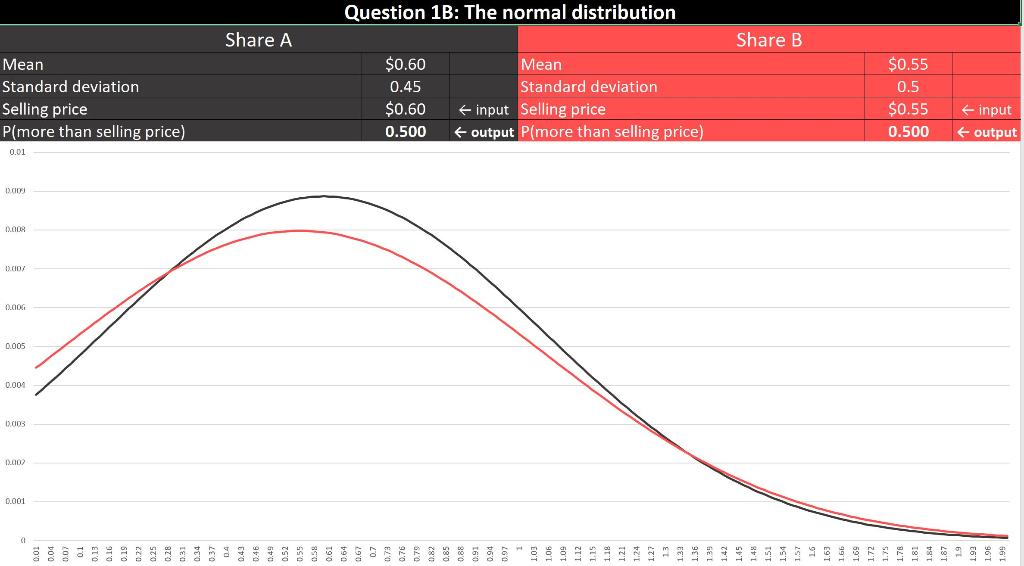
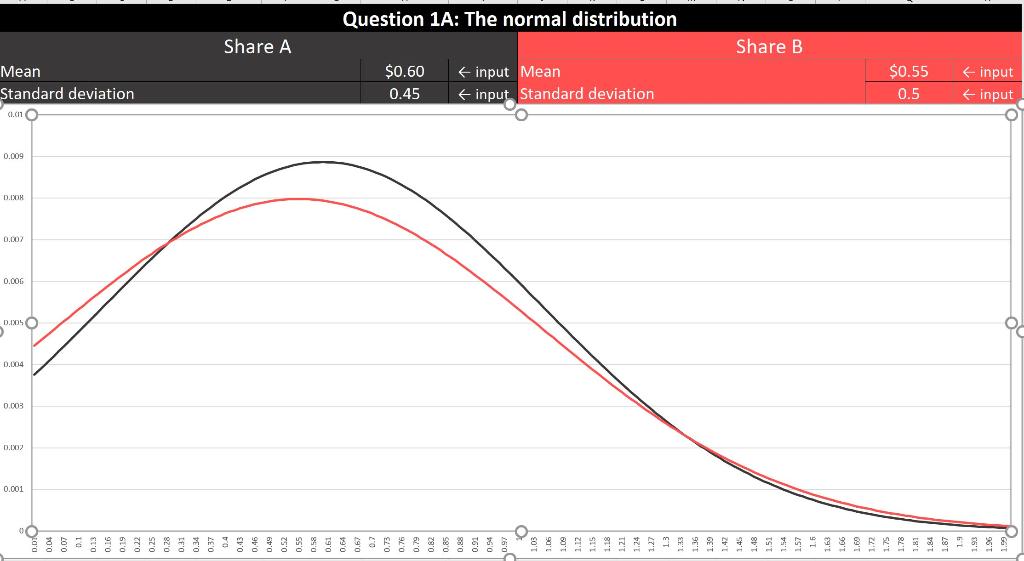
Table 1: Average share price and standard deviation.
| Share | Mean | Standard deviation |
| Share A | $0.60 | $0.45 |
| Share B | $0.55 | $0.5 |
Step by Step Solution
There are 3 Steps involved in it
Step: 1

Get Instant Access to Expert-Tailored Solutions
See step-by-step solutions with expert insights and AI powered tools for academic success
Step: 2

Step: 3
Ace Your Homework with AI
Get the answers you need in no time with our AI-driven, step-by-step assistance
Get Started