Answered step by step
Verified Expert Solution
Link Copied!

Question

1 Approved Answer

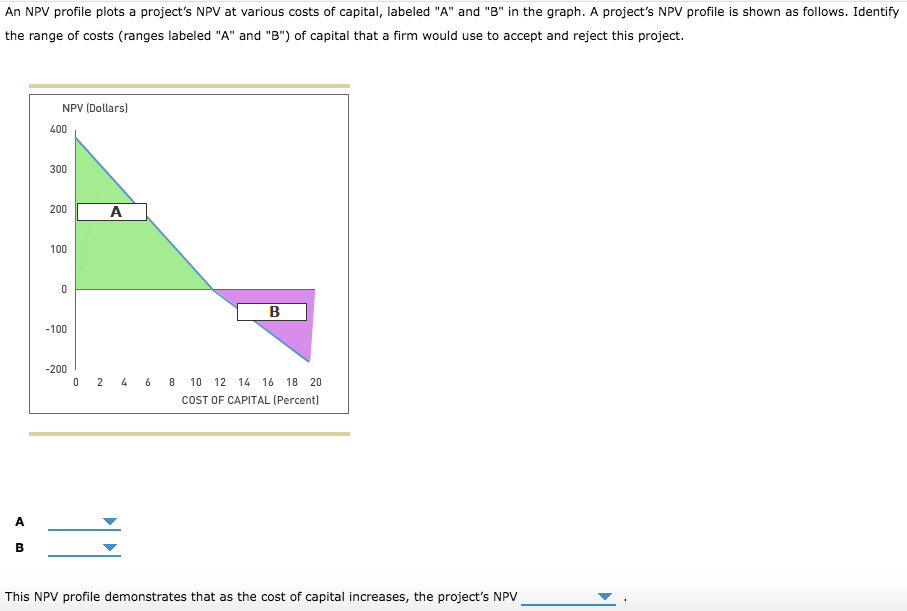
An NPV profile plots a project's NPV at various costs of capital, labeled A and B in the graph. A project's NPV profile is shown

image text in transcribed

An NPV profile plots a project's NPV at various costs of capital, labeled "A" and "B" in the graph. A project's NPV profile is shown as follows. Identify the range of costs (ranges labeled "A" and "B") of capital that a firm would use to accept and reject this project. NPV (Dollars) 400 300 200 A 100 0 B -100 -200 0 2 4 6 8 10 12 14 16 18 20 COST OF CAPITAL (Percent) A B This NPV profile demonstrates that as the cost of capital increases, the project's NPV

Step by Step Solution

There are 3 Steps involved in it

Step: 1

blur-text-image

Get Instant Access to Expert-Tailored Solutions

See step-by-step solutions with expert insights and AI powered tools for academic success

Step: 2

blur-text-image

Step: 3

blur-text-image

Ace Your Homework with AI

Get the answers you need in no time with our AI-driven, step-by-step assistance

Get Started

Recommended Textbook for

Labour Finance And Inequality

Authors: Suzanne J. Konzelmann, Simon Deakin, Marc Fovargue-Davies, Frank Wilkinson

1st Edition

1138919721, 978-1138919723

More Books

Students also viewed these Finance questions

Question

2. What is the business value of security and control?

Answered: 1 week ago