

Answered step by step
Verified Expert Solution
Question
1 Approved Answer
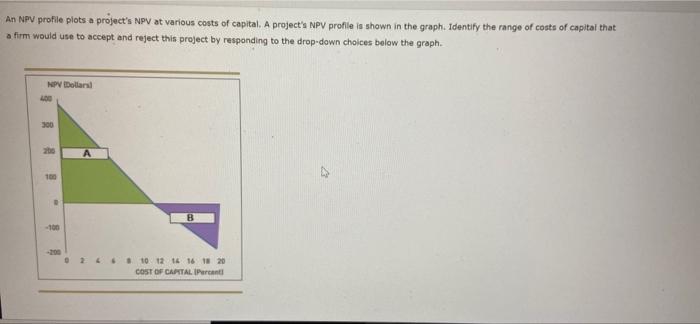
An NPV profile plots a project's NPV at various costs of capital. A project's NPV profile is shown in the graph. Identify the range of

Step by Step Solution
There are 3 Steps involved in it
Step: 1

Get Instant Access to Expert-Tailored Solutions
See step-by-step solutions with expert insights and AI powered tools for academic success
Step: 2

Step: 3
Ace Your Homework with AI
Get the answers you need in no time with our AI-driven, step-by-step assistance
Get Started
Finance For Normal People
Authors: Meir Statman
1st Edition
019062647X, 978-0190626471