Answered step by step
Verified Expert Solution
Link Copied!

Question

1 Approved Answer

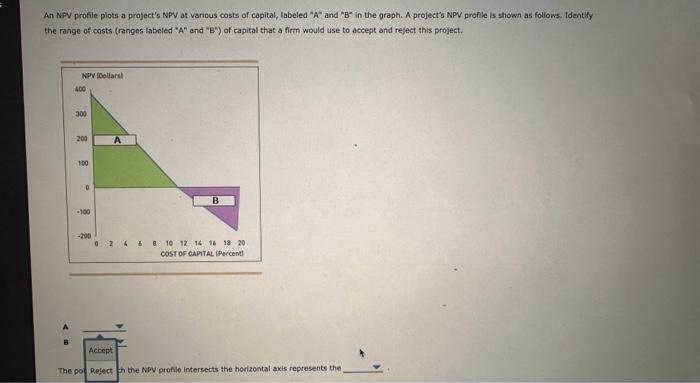
An NPV profile plots a project's NPV at various costs of capital, labeled A and B in the graph. A project's NPV profle is shown

image text in transcribed
An NPV profile plots a project's NPV at various costs of capital, labeled "A" and "B" in the graph. A project's NPV profle is shown as follows. Ifentify the range of costs (ranges labeled "A" and "B") of capital that a firm would use to accept and reject this project. the NPV profile intersects the horizontal axis represents the A WACC B IRR An NPV profile plots a project's NPV at various costs of capital, labeled "A" and "B" in the graph. A project's NPV profle is shown as follows. Ifentify the range of costs (ranges labeled "A" and "B") of capital that a firm would use to accept and reject this project. the NPV profile intersects the horizontal axis represents the A WACC B IRR

Step by Step Solution

There are 3 Steps involved in it

Step: 1

blur-text-image

Get Instant Access to Expert-Tailored Solutions

See step-by-step solutions with expert insights and AI powered tools for academic success

Step: 2

blur-text-image

Step: 3

blur-text-image

Ace Your Homework with AI

Get the answers you need in no time with our AI-driven, step-by-step assistance

Get Started

Recommended Textbook for

Full IFRS And IFRS For SMEs Adoption By Private Firms Empirical Evidence On Country Level

Authors: Maximilian Saucke

1st Edition

363166298X,3653055318

More Books

Students also viewed these Finance questions

Question

What are the main elements of green strategy and sustainability?

Answered: 1 week ago