Answered step by step
Verified Expert Solution
Question
1 Approved Answer
An online clothing retailer monitors its order-filling process. Each week, the quality control manager selects a random sample of size n = 200 orders that
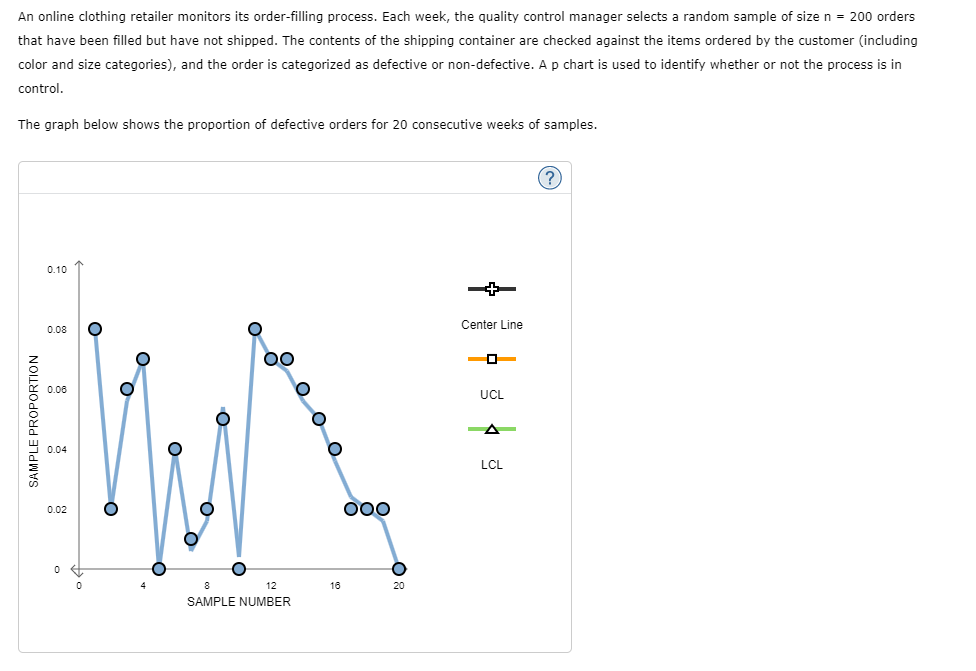
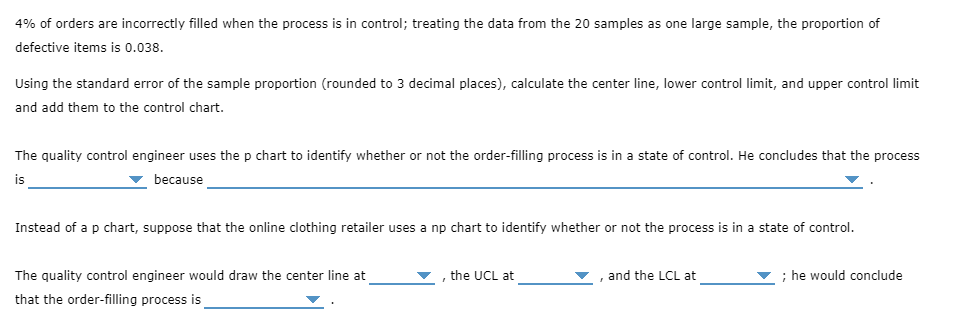
An online clothing retailer monitors its order-filling process. Each week, the quality control manager selects a random sample of size n = 200 orders that have been filled but have not shipped. The contents of the shipping container are checked against the items ordered by the customer (including color and size categories), and the order is categorized as defective or non-defective. A p chart is used to identify whether or not the process is in control. The graph below shows the proportion of defective orders for 20 consecutive weeks of samples. @ 010 00e Center Line = e B 2 T x 0.08 ucL o o A 0.04 = LCL =L w 0.02 o o 4 2 12 16 20 SAMPLE NUMBER 4% of orders are incorrectly filled when the process is in control; treating the data from the 20 samples as one large sample, the propartion of defective items is 0.038. Using the standard error of the sample proportion {rounded to 3 decimal places), calculate the center line, lower control limit, and upper control limit and add them to the control chart. The quality control engineer uses the p chart to identify whether or not the order-filling process is in a state of control. He concludes that the process is ' because v Instead of a p chart, suppose that the online clothing retailer uses a np chart to identify whether or not the process is in a state of control. The quality control engineer would draw the center line at w , the UCL at w , and the LCL at w : he would conclude that the order-filling process is v
Step by Step Solution
There are 3 Steps involved in it
Step: 1
Get Instant Access to Expert-Tailored Solutions
See step-by-step solutions with expert insights and AI powered tools for academic success
Step: 2
Step: 3
Ace Your Homework with AI
Get the answers you need in no time with our AI-driven, step-by-step assistance
Get Started