

Answered step by step
Verified Expert Solution
Question
1 Approved Answer
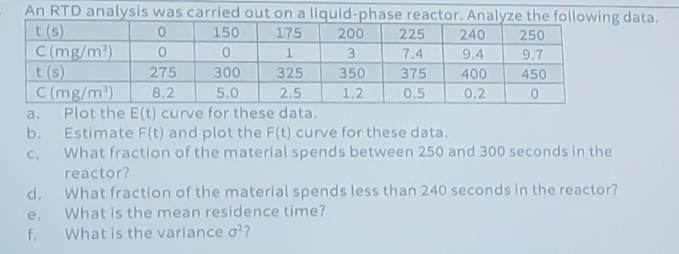
An RTD analysis was carried out on a liquid - phase reactor. Analyze the following data. table [ [ t ( s ) ,
An RTD analysis was carried out on a liquidphase reactor. Analyze the following data.
table
a Plot the curve for these data.
b Estimate and plot the curve for these data.
c What fraction of the materlal spends between and seconds in the reactor?
d What fractlon of the material spends less than seconds in the reactor?
e What is the mean residence time?
f What is the varlance
Step by Step Solution
There are 3 Steps involved in it
Step: 1

Get Instant Access to Expert-Tailored Solutions
See step-by-step solutions with expert insights and AI powered tools for academic success
Step: 2

Step: 3
Ace Your Homework with AI
Get the answers you need in no time with our AI-driven, step-by-step assistance
Get Started
Elementary Principles of Chemical Processes
Authors: Richard M. Felder, Ronald W. Rousseau, Lisa G. Bullard
4th edition
978-1118431221, 9781119192138, 1118431227, 1119192137, 978-1119498759