Answered step by step
Verified Expert Solution
Question
1 Approved Answer
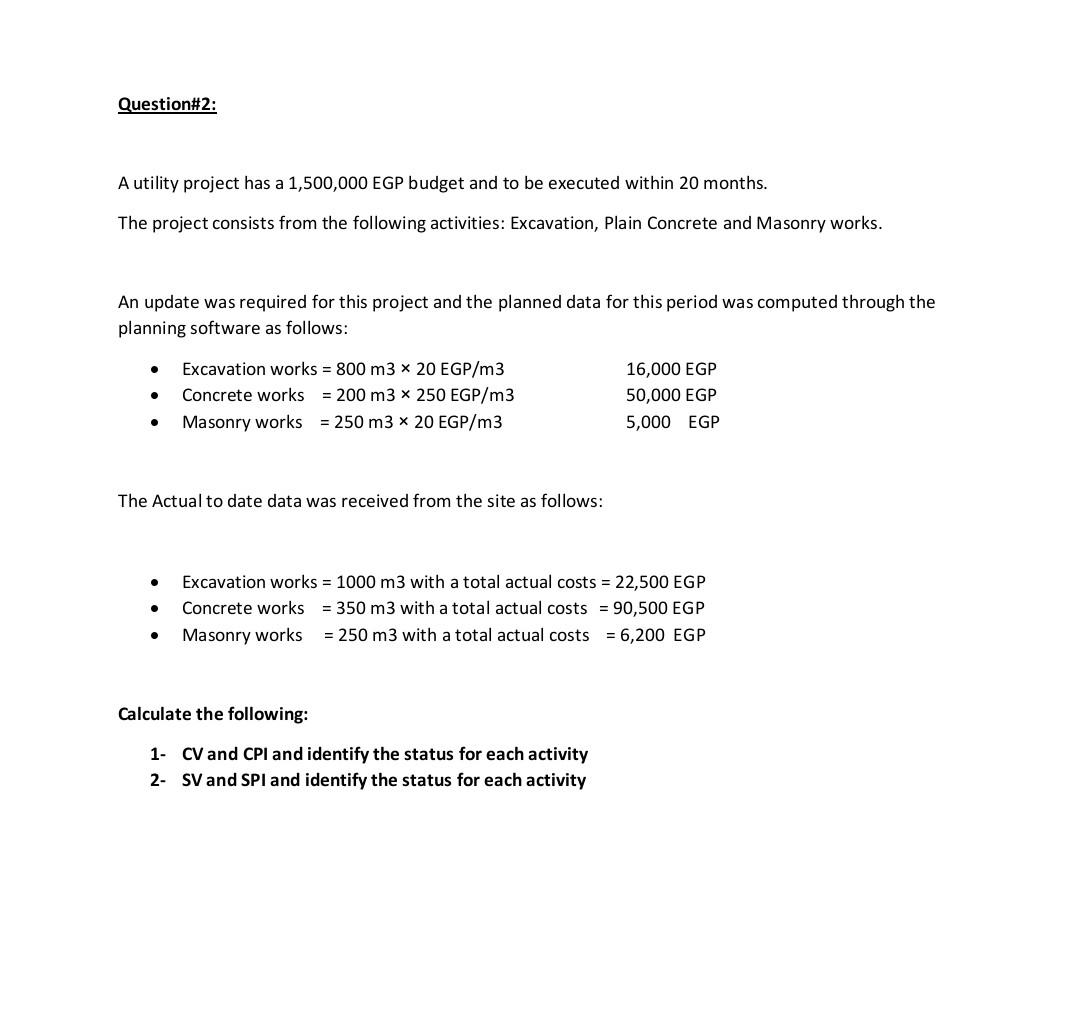
An update was required for this project and the planned data for this period was computed through the planning software as follows: - Excavation works


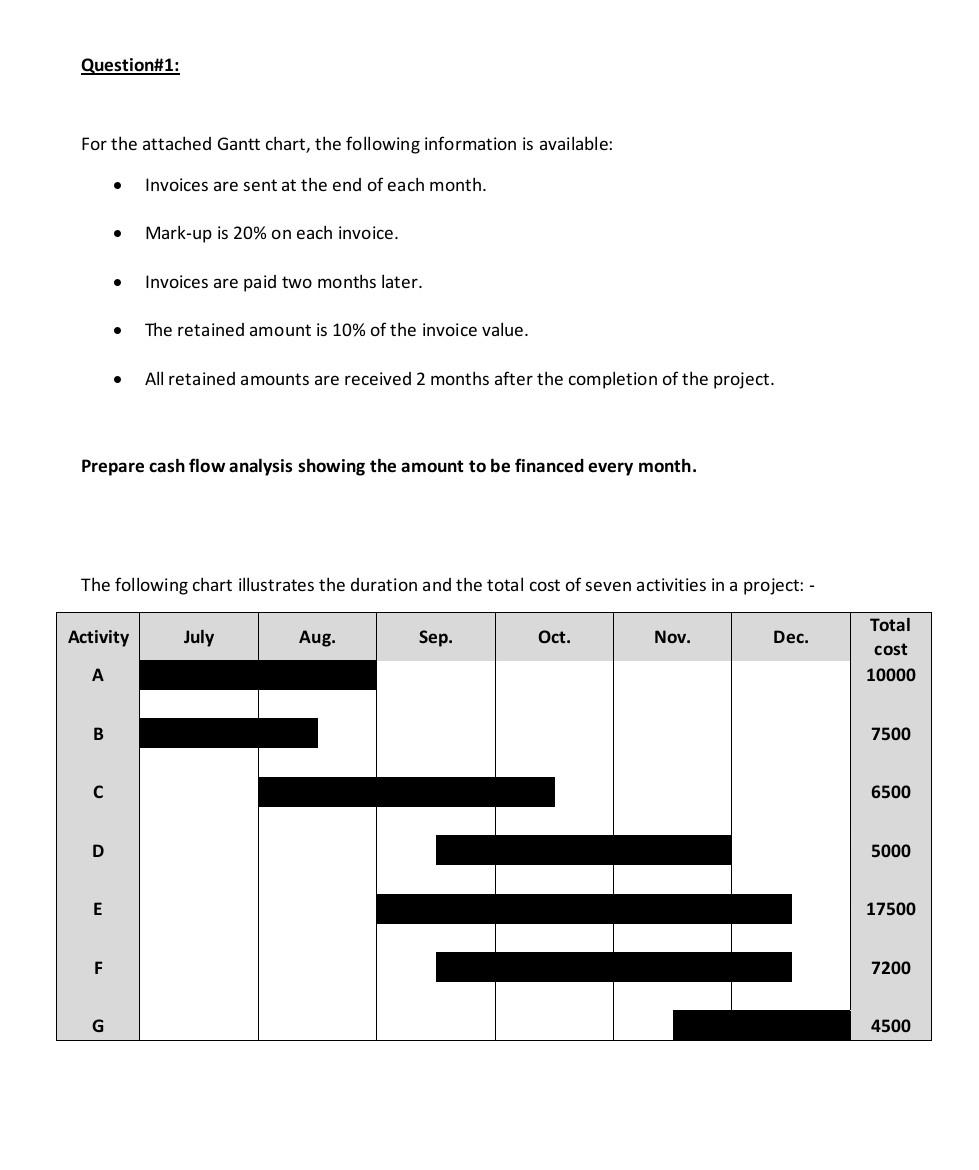
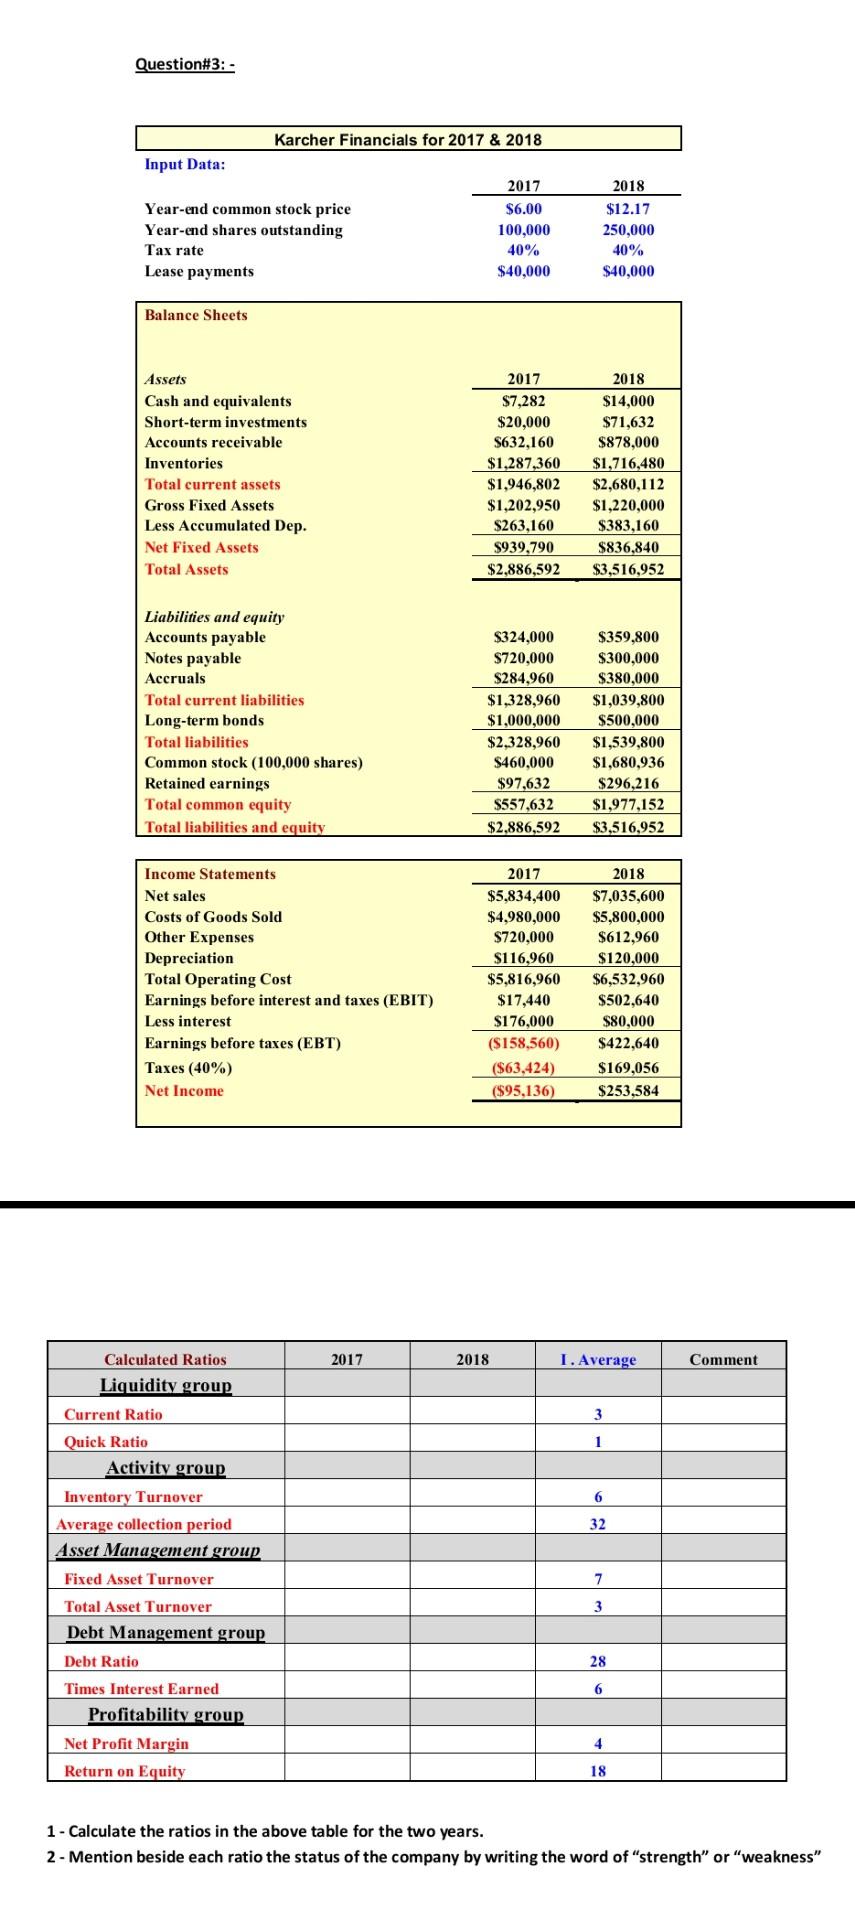
An update was required for this project and the planned data for this period was computed through the planning software as follows: - Excavation works =800m320EGP/m3 16,000 EGP - Concrete works =200m3250EGP/m3 50,000 EGP - Masonry works =250m320EGP/m3 5,000 EGP The Actual to date data was received from the site as follows: - Excavation works =1000m3 with a total actual costs =22,500EGP - Concrete works =350m3 with a total actual costs =90,500EGP - Masonry works =250m3 with a total actual costs =6,200EGP Calculate the following: 1- CV and CPI and identify the status for each activity 2- SV and SPI and identify the status for each activity For the attached Gantt chart, the following information is available: - Invoices are sent at the end of each month. - Mark-up is 20% on each invoice. - Invoices are paid two months later. - The retained amount is 10% of the invoice value. - All retained amounts are received 2 months after the completion of the project. Prepare cash flow analysis showing the amount to be financed every month. The following chart illustrates the duration and the total cost of seven activities in a project: - Question\#3: - Karcher Financials for 2017 \& 2018 Input Data: \begin{tabular}{lcc} & 2017 & 2018 \\ \cline { 2 - 3 } Year-end common stock price & $6.00 & $12.17 \\ Year-end shares outstanding & 100,000 & 250,000 \\ Tax rate & 40% & 40% \\ Lease payments & $40,000 & $40,000 \end{tabular} Balance Sheets Assets Cash and equivalents Short-term investments Accounts receivable Inventories Total current assets Gross Fixed Assets Less Accumulated Dep. Net Fixed Assets Total Assets Liabilities and equity Accounts payable Notes payable Accruals Total current liabilities Long-term bonds Total liabilities Common stock ( 100,000 shares ) Retained earnings Total common equity Total liabilities and equity \begin{tabular}{cc|} 2017 & 2018 \\ \hline$7,282 & $14,000 \\ $20,000 & $71,632 \\ $632,160 & $878,000 \\ $1,287,360 & $1,716,480 \\ \hline$1,946,802 & $2,680,112 \\ $1,202,950 & $1,220,000 \\ $263,160 & $383,160 \\ \hline$939,790 & $836,840 \\ \hline$2,886,592 & $3,516,952 \\ \hline \end{tabular} Income Statements Net sales Costs of Goods Sold Other Expenses Depreciation Total Operating Cost Earnings before interest and taxes (EBIT) Less interest Earnings before taxes (EBT) Taxes (40%) Net Income \begin{tabular}{cc} $324,000 & $359,800 \\ $720,000 & $300,000 \\ $284,960 & $380,000 \\ \hline$1,328,960 & $1,039,800 \\ $1,000,000 & $500,000 \\ \hline$2,328,960 & $1,539,800 \\ $460,000 & $1,680,936 \\ $97,632 & $296,216 \\ \hline$557,632 & $1,977,152 \\ \hline$2,886,592 & $3,516,952 \\ \hline \end{tabular} \begin{tabular}{cc|} \hline 2017 & 2018 \\ \hline$5,834,400 & $7,035,600 \\ $4,980,000 & $5,800,000 \\ $720,000 & $612,960 \\ $116,960 & $120,000 \\ \hline$5,816,960 & $6,532,960 \\ $17,440 & $502,640 \\ $176,000 & $80,000 \\ \hline($158,560) & $422,640 \\ ($63,424) & $169,056 \\ \hline($95,136) & $253,584 \\ \hline & \\ \hline \end{tabular} \begin{tabular}{|c|c|c|c|c|} \hline Calculated Ratios & 2017 & 2018 & I. Average & Comment \\ \hline Liquidity group & & & & \\ \hline Current Ratio & & & 3 & \\ \hline Quick Ratio & & & & \\ \hline Activitv group & & & 6 & \\ \hline Inventory Turnover & & & 32 & \\ \hline Average collection period & & & 7 & \\ \hline Asset Management group & & & 3 & \\ \hline Fixed Asset Turnover & & & & \\ \hline Total Asset Turnover & & & 6 & \\ \hline Debt Management group & & & & \\ \hline Debt Ratio & & & 18 & \\ \hline Times Interest Earned & & & & \\ \hline Profitability group & & & & \\ \hline Net Profit Margin & & & & \\ \hline Return on Equity & & & & \\ \hline \end{tabular} 1 - Calculate the ratios in the above table for the two years. 2 - Mention beside each ratio the status of the company by writing the word of "strength" or "weakness
Step by Step Solution
There are 3 Steps involved in it
Step: 1

Get Instant Access to Expert-Tailored Solutions
See step-by-step solutions with expert insights and AI powered tools for academic success
Step: 2

Step: 3

Ace Your Homework with AI
Get the answers you need in no time with our AI-driven, step-by-step assistance
Get Started


