Answered step by step
Verified Expert Solution
Question
1 Approved Answer
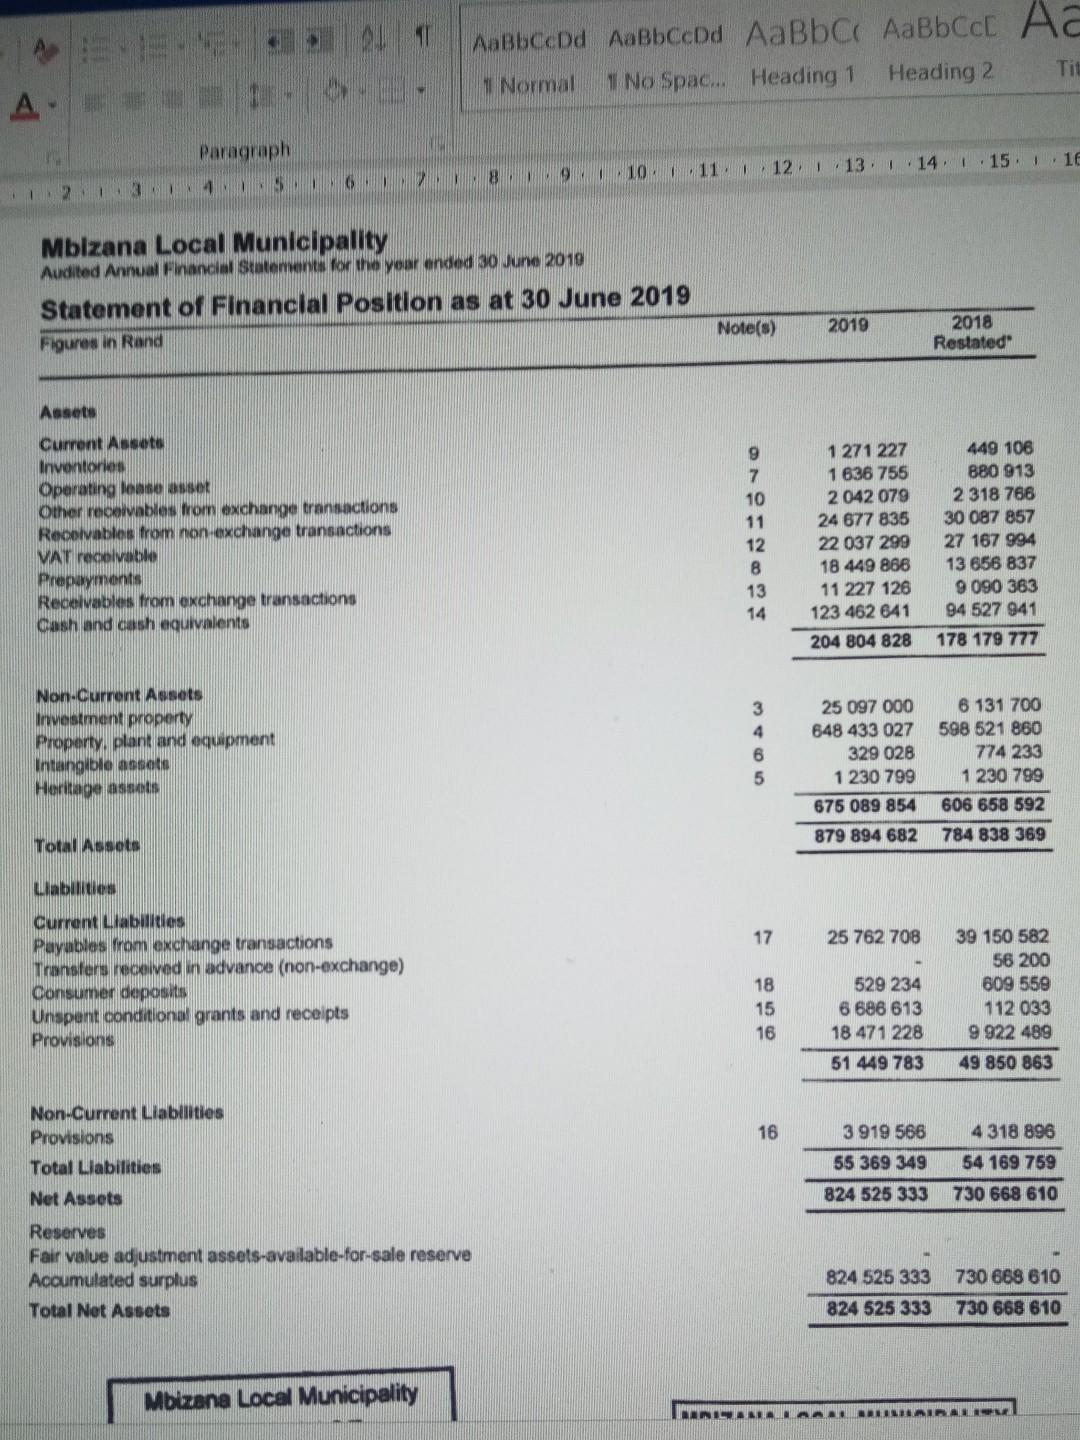
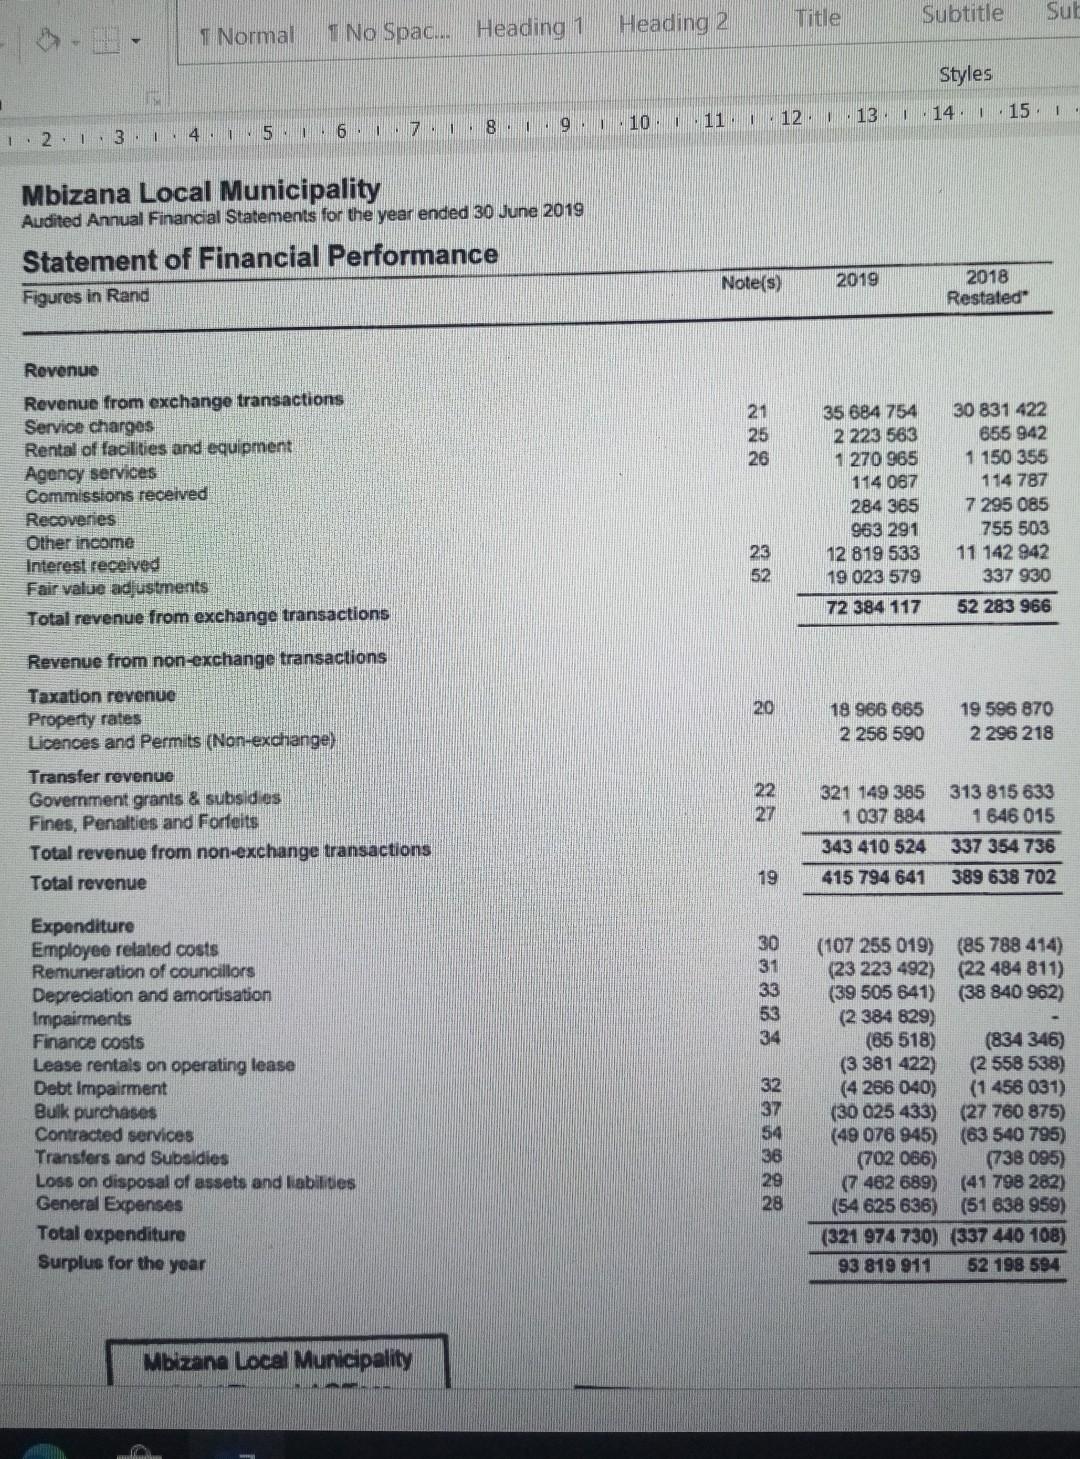
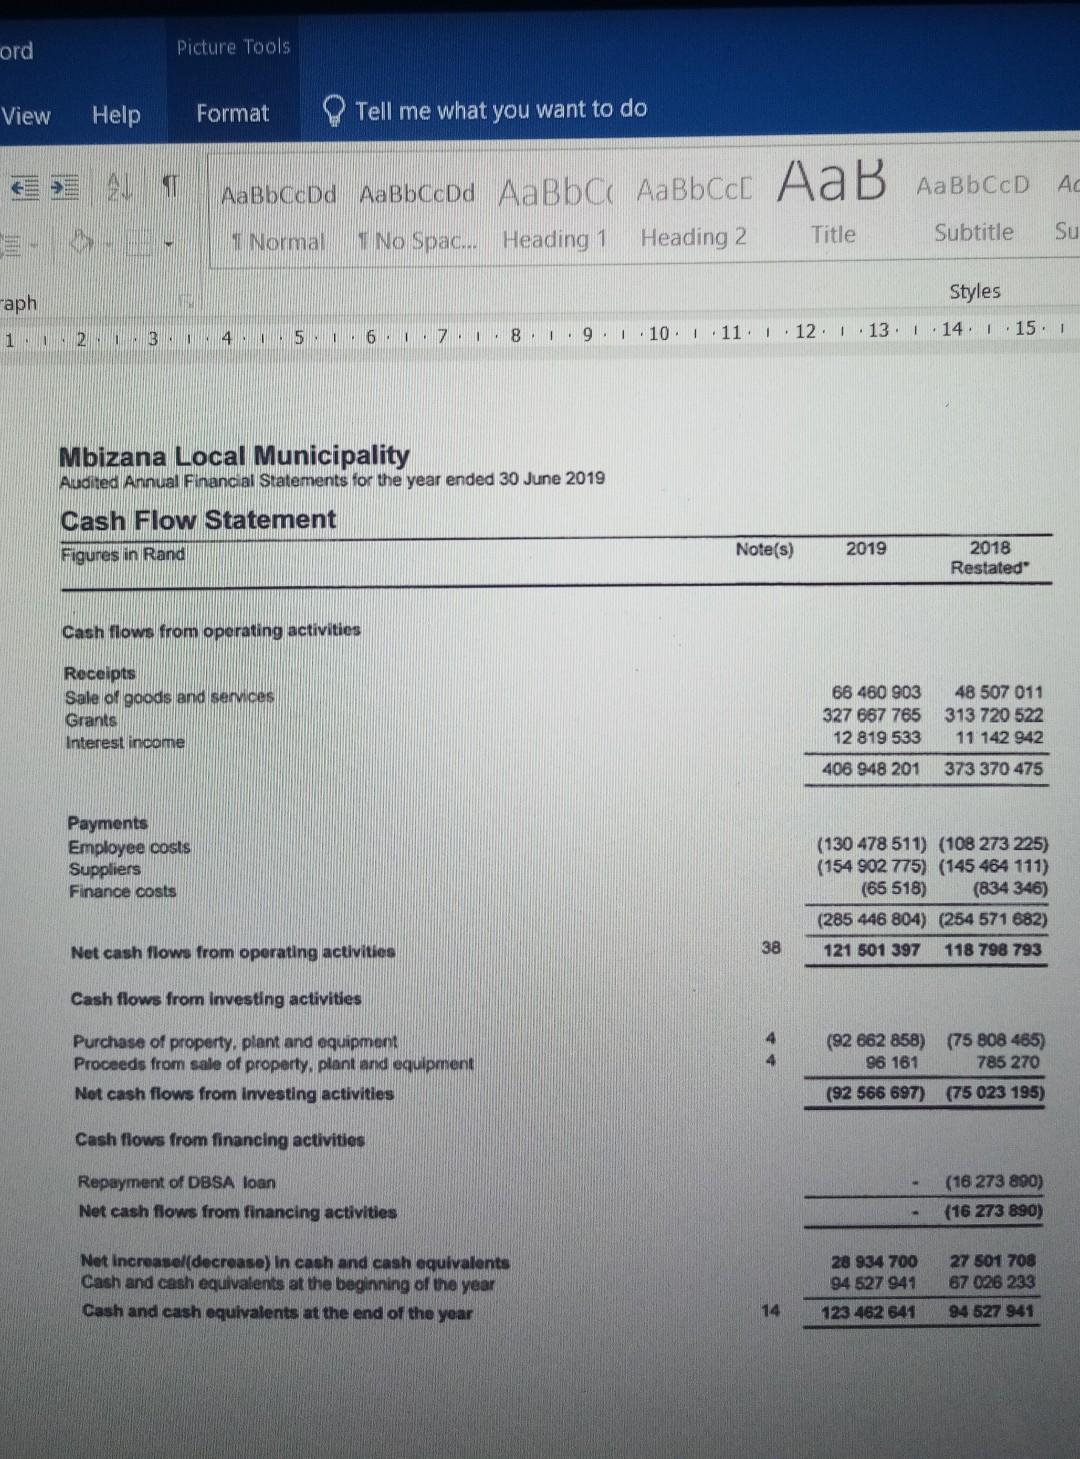
Analyse and interpret your municipalitys financial statements for the year ended 30 June 2019 and determine and comment on its performance by making use of


Analyse and interpret your municipalitys financial statements for the year ended 30 June 2019 and determine and comment on its performance by making use of ratio analysis.
Prepare your analysis in terms of: 1. Statement of financial position
AaBbceod AaBbceod AaBbcc Aabbcc Ac Tit Normal 1 No Spac... Heading 1 Heading 2 Paragraph 1 10 12 13 14 15.11 1 1 5 2 Mblzana Local Municipality Audited Annual Financial Statements for the year anded 30 June 2010 Statement of Financial Position as at 30 June 2019 Figures in Rand Note(s) 2019 2018 Restated Assets Current Assets Inventories Operating Ronse onset Other receivables from exchange transactions Receivables from non-exchange transactions VAT receivable Prepayments Receivables from exchange transactions Cash and cash equivalents 9 7 10 11 12 B 13 14 1 271 227 1 636 755 2042 079 24 677 835 22 037 299 18 449 866 11 227 126 123 462 641 449 106 880 913 2 318 766 30 087 857 27 167 994 13 656 837 9 090 363 94 527 941 204 804 828 178 179 777 3 4 Non-Current Assets Inwestment property Property, plant and equipment Intangible assets Heritage assets 25 097 000 648 433 027 329 028 1 230 799 O 6 131 700 598 521 860 774 233 1 230 799 606 658 592 5 676 089 854 879 894 682 784 838 369 Total Assets Liabilities 17 25 762 708 Current Liabilities Payubles from exchange transactions Transfers received in advance (non-exchange) Consumer deposits Unspunt conditional grants and receipts Provisions 18 15 16 529 234 6 686 613 18 471 228 39 150 582 56 200 609 559 112 033 9922 489 51 449 783 49 850 863 Non-Current Liabilities Provisions 16 3 919 566 4 318 896 Total Liabilities 55 369 349 54 169 759 Net Assets 824 525 333 730 668 610 Reserves Fair value adjustment assets-available-for-sale reserve Accumulated surplus 824 525 333 730 688 610 730 668 610 Total Net Assets 824 525 333 Mbizana Local Municipality AANLAALAAAAAABAAIRAS Title Subtitle Sul Normal Heading 2 I No Spac... Heading 1 Styles 12. 13. 14. 15. 8 10 11 9 6 7 4 5 2.13 1 Mbizana Local Municipality Audited Annual Financial Statements for the year ended 30 June 2019 Statement of Financial Performance Figures in Rand Note(s) 2019 2018 Restated" Revenue 21 125 26 Revenue from exchange transactions Service charges Rental of facilities and equipment Agency services Commissions received Recoveries Other income Interest received Fair value adjustments Total revenue from exchange transactions 35 684 754 2 223 563 1 270 965 114 067 284 365 963 291 12 819 533 19 023 579 30 831 422 655 942 1 150 355 114 787 7 295 085 755 503 11 142 942 337 930 23 52 72 384 117 52 283 966 Revenue from non-exchange transactions 20 18 966 665 2 256 590 19 596 870 2296 218 Taxation revenue Property rates Licences and Permits (Non-exchange) Transfer revenue Government grants & subsidies Fines, Penalties and Fortelts Total revenue from non-exchange transactions Total revenue 22 27 321 149 385 1037 884 313 815 633 1 646 015 343 410 524 337 354 736 19 415 794 641 389 638 702 30 31 33 53 34 Expenditure Employee related costs Remuneration of councillors Depreciation and amortisation Impairments Finance costs Lease rentals on operating lease Debt Impairment Bulk purchases Contracted services Transfers and Subsidies Loss on disposal of assets and liabilities General Expenses Total expenditure Surplus for the year 32 37 54 36 29 28 (107 255 019) (85 788 414) (23 223 492) (22 484 811) (39 505 641) (38 840 962) (2 384 829) (85 518) (834 346) (3 381 422) (2 558 538) (4266 040) (1 456 031) (30 025 433) (27 760 875) (49 076 945) (63 540 795) (702 066) (738 095) (7 482 689) (41 798 282) (54 625 636) (51 638 959) (321 974 730) (337 440 108) 93 819 911 52 198 594 Mbizana Local Municipality ord Picture Tools View Help Format Tell me what you want to do E cDd cDd AaBbct Normal T No Spac... Heading 1 Heading 2 Title Su Subtitle Styles "aph 2 3 14. 1 15.1 1 4 5 6 7 1 18 9 101 . 11. 1. 12. 13. 1 Mbizana Local Municipality Audited Annual Financial Statements for the year ended 30 June 2019 Cash Flow Statement Figures in Rand Note(s) 2019 2018 Restated" Cash flows from operating activities Receipts Sale of goods and services Grants Interest income 66 460 903 48 507 011 327 667 765 313 720 522 12 819 533 11 142 942 406 948 201 373 370 475 Payments Employee costs Suppliers Finance costs (130 478 511) (108 273 225) (154 902 775) (145 464 111) (65 518) (834 346) (285 446 804) (254 571 682) Net cash flows from operating activities 38 121 501 397 118 798 793 Cash flows from investing activities Purchase of property, plant and equipment Proceeds from sale of property, plant and equipment Net cash flows from Investing activities (92 662 858) (75 808 485) 96 161 785 270 (92 566 697) (75 023 195) Cash flows from financing activities Repayment of DBSA loan (16 273 890) (16 273 890) Net cash flows from financing activities Net Increasel(decrease) In cash and cash equivalents Cash and cash equivalents at the beginning of the year Cash and cash equivalents at the end of the year 28 934 700 94 527 941 27 501 708 67 026 233 14 123 462 641 94 527 941Step by Step Solution
There are 3 Steps involved in it
Step: 1

Get Instant Access to Expert-Tailored Solutions
See step-by-step solutions with expert insights and AI powered tools for academic success
Step: 2

Step: 3

Ace Your Homework with AI
Get the answers you need in no time with our AI-driven, step-by-step assistance
Get Started


