Answered step by step
Verified Expert Solution
Question
1 Approved Answer
Analyse the ANZ company's share price history and traded volumes over the chosen analysis period. ANZ Historical Data i i Time Frame: Monthly Download Data
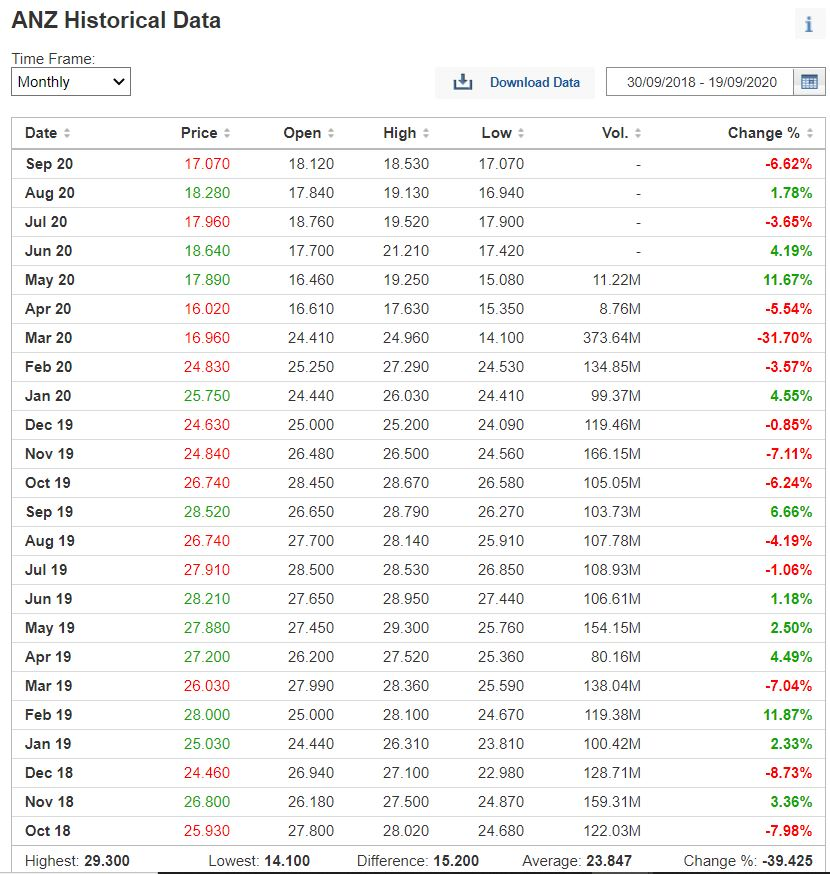
Analyse the ANZ company's share price history and traded volumes over the chosen analysis period.
ANZ Historical Data i i Time Frame: Monthly Download Data 30/09/2018 - 19/09/2020 Date Price : Open High Low- Vol. Change % 17.070 17.070 -6.62% 18.120 17.840 18.530 19.130 18.280 16.940 1.78% 17.960 18.760 19.520 17.900 - -3.65% 18.640 17.700 21.210 17.420 - 4.19% Sep 20 Aug 20 Jul 20 Jun 20 May 20 Apr 20 Mar 20 Feb 20 17.890 16.460 19.250 15.080 11.22M 11.67% 16.020 16.610 17.630 15.350 8.76M -5.54% 24.410 24.960 14.100 373.64M -31.70% 16.960 24.830 25.250 27.290 24.530 134.85M -3.57% Jan 20 25.750 24.440 26.030 24.410 99.37M 4.55% Dec 19 24.630 25.000 25.200 24.090 119.46M -0.85% Nov 19 24.840 26.480 26.500 24.560 166.15M -7.11% 26.740 28.450 28.670 26.580 105.05M -6.24% 28.520 26.650 28.790 26.270 6.66% 103.73M 107.78M 26.740 27.700 28.140 25.910 -4.19% 27.910 28.500 28.530 26.850 108.93M -1.06% Oct 19 Sep 19 Aug 19 Jul 19 Jun 19 May 19 Apr 19 Mar 19 Feb 19 28.210 27.650 28.950 27.440 106.61M 1.18% 27.880 27.450 29.300 25.760 154.15M 2.50% 27.200 26.200 27.520 25.360 80.16M 4.49% 27.990 28.360 25.590 138.04M -7.04% 26.030 28.000 25.000 28.100 24.670 119.38M 11.87% Jan 19 25.030 24.440 26.310 23.810 100.42M 2.33% 24.460 26.940 27.100 22.980 128.71M -8.73% 26.800 26.180 27.500 24.870 3.36% Dec 18 Nov 18 Oct 18 Highest: 29.300 159.31M 122.03M 25.930 27.800 28.020 24.680 -7.98% Lowest: 14.100 Difference: 15.200 Average: 23.847 Change %: -39.425Step by Step Solution
There are 3 Steps involved in it
Step: 1
Get Instant Access to Expert-Tailored Solutions
See step-by-step solutions with expert insights and AI powered tools for academic success
Step: 2
Step: 3
Ace Your Homework with AI
Get the answers you need in no time with our AI-driven, step-by-step assistance
Get Started