-
 Analyse the trend of the segment of the Cochlear Limited - COH for the last 5 years (e.g., revenue, expenses, assets and liabilities).
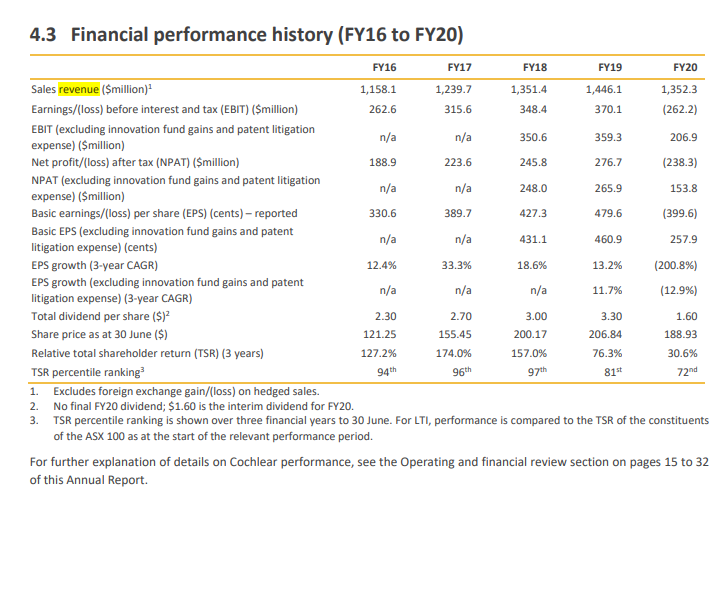
FY17 FY18 350.6 359.3 265.9 153.8 427.3 431.1 460.9 4.3 Financial performance history (FY16 to FY20) FY16 FY19 FY20 Sales revenue (Smillion) 1,158.1 1,239.7 1,351.4 1,446.1 1,352.3 Earnings/(loss) before interest and tax (EBIT) (Smillion) 262.6 315.6 348.4 370.1 (262.2) EBIT (excluding innovation fund gains and patent litigation n/a n/a 206.9 expense) ($million) Net profit/(loss) after tax (NPAT) ($million) 188.9 223.6 245.8 276.7 (238.3) NPAT (excluding innovation fund gains and patent litigation n/a n/a 248.0 expense) ($million) Basic earnings/(loss) per share (EPS) (cents) - reported 330.6 389.7 479.6 (399.6) Basic EPS (excluding innovation fund gains and patent n/a n/a 257.9 litigation expense) (cents) EPS growth (3-year CAGR) 12.4% 33.3% 13.2% (200.8%) EPS growth (excluding innovation fund gains and patent n/a 11.7% litigation expense) (3-year CAGR) (12.9%) Total dividend per share ($)2 3.30 Share price as at 30 June ($) 121.25 155.45 200.17 206.84 188.93 Relative total shareholder return (TSR) (3 years) 127.2% 174.0% 157.0% 76.3% TSR percentile ranking 94th 96th 97th 815 72nd 1. Excludes foreign exchange gain/loss) on hedged sales. 2. No final FY20 dividend; $1.60 is the interim dividend for FY20. 3. TSR percentile ranking is shown over three financial years to 30 June. For LTI, performance is compared to the TSR of the constituents of the ASX 100 as at the start of the relevant performance period. For further explanation of details on Cochlear performance, see the Operating and financial review section on pages 15 to 32 of this Annual Report 18.6% n/a n/a 2.30 2.70 3.00 1.60 30.6% FY17 FY18 350.6 359.3 265.9 153.8 427.3 431.1 460.9 4.3 Financial performance history (FY16 to FY20) FY16 FY19 FY20 Sales revenue (Smillion) 1,158.1 1,239.7 1,351.4 1,446.1 1,352.3 Earnings/(loss) before interest and tax (EBIT) (Smillion) 262.6 315.6 348.4 370.1 (262.2) EBIT (excluding innovation fund gains and patent litigation n/a n/a 206.9 expense) ($million) Net profit/(loss) after tax (NPAT) ($million) 188.9 223.6 245.8 276.7 (238.3) NPAT (excluding innovation fund gains and patent litigation n/a n/a 248.0 expense) ($million) Basic earnings/(loss) per share (EPS) (cents) - reported 330.6 389.7 479.6 (399.6) Basic EPS (excluding innovation fund gains and patent n/a n/a 257.9 litigation expense) (cents) EPS growth (3-year CAGR) 12.4% 33.3% 13.2% (200.8%) EPS growth (excluding innovation fund gains and patent n/a 11.7% litigation expense) (3-year CAGR) (12.9%) Total dividend per share ($)2 3.30 Share price as at 30 June ($) 121.25 155.45 200.17 206.84 188.93 Relative total shareholder return (TSR) (3 years) 127.2% 174.0% 157.0% 76.3% TSR percentile ranking 94th 96th 97th 815 72nd 1. Excludes foreign exchange gain/loss) on hedged sales. 2. No final FY20 dividend; $1.60 is the interim dividend for FY20. 3. TSR percentile ranking is shown over three financial years to 30 June. For LTI, performance is compared to the TSR of the constituents of the ASX 100 as at the start of the relevant performance period. For further explanation of details on Cochlear performance, see the Operating and financial review section on pages 15 to 32 of this Annual Report 18.6% n/a n/a 2.30 2.70 3.00 1.60 30.6%
 Analyse the trend of the segment of the Cochlear Limited - COH for the last 5 years (e.g., revenue, expenses, assets and liabilities).


