Answered step by step
Verified Expert Solution
Question
1 Approved Answer
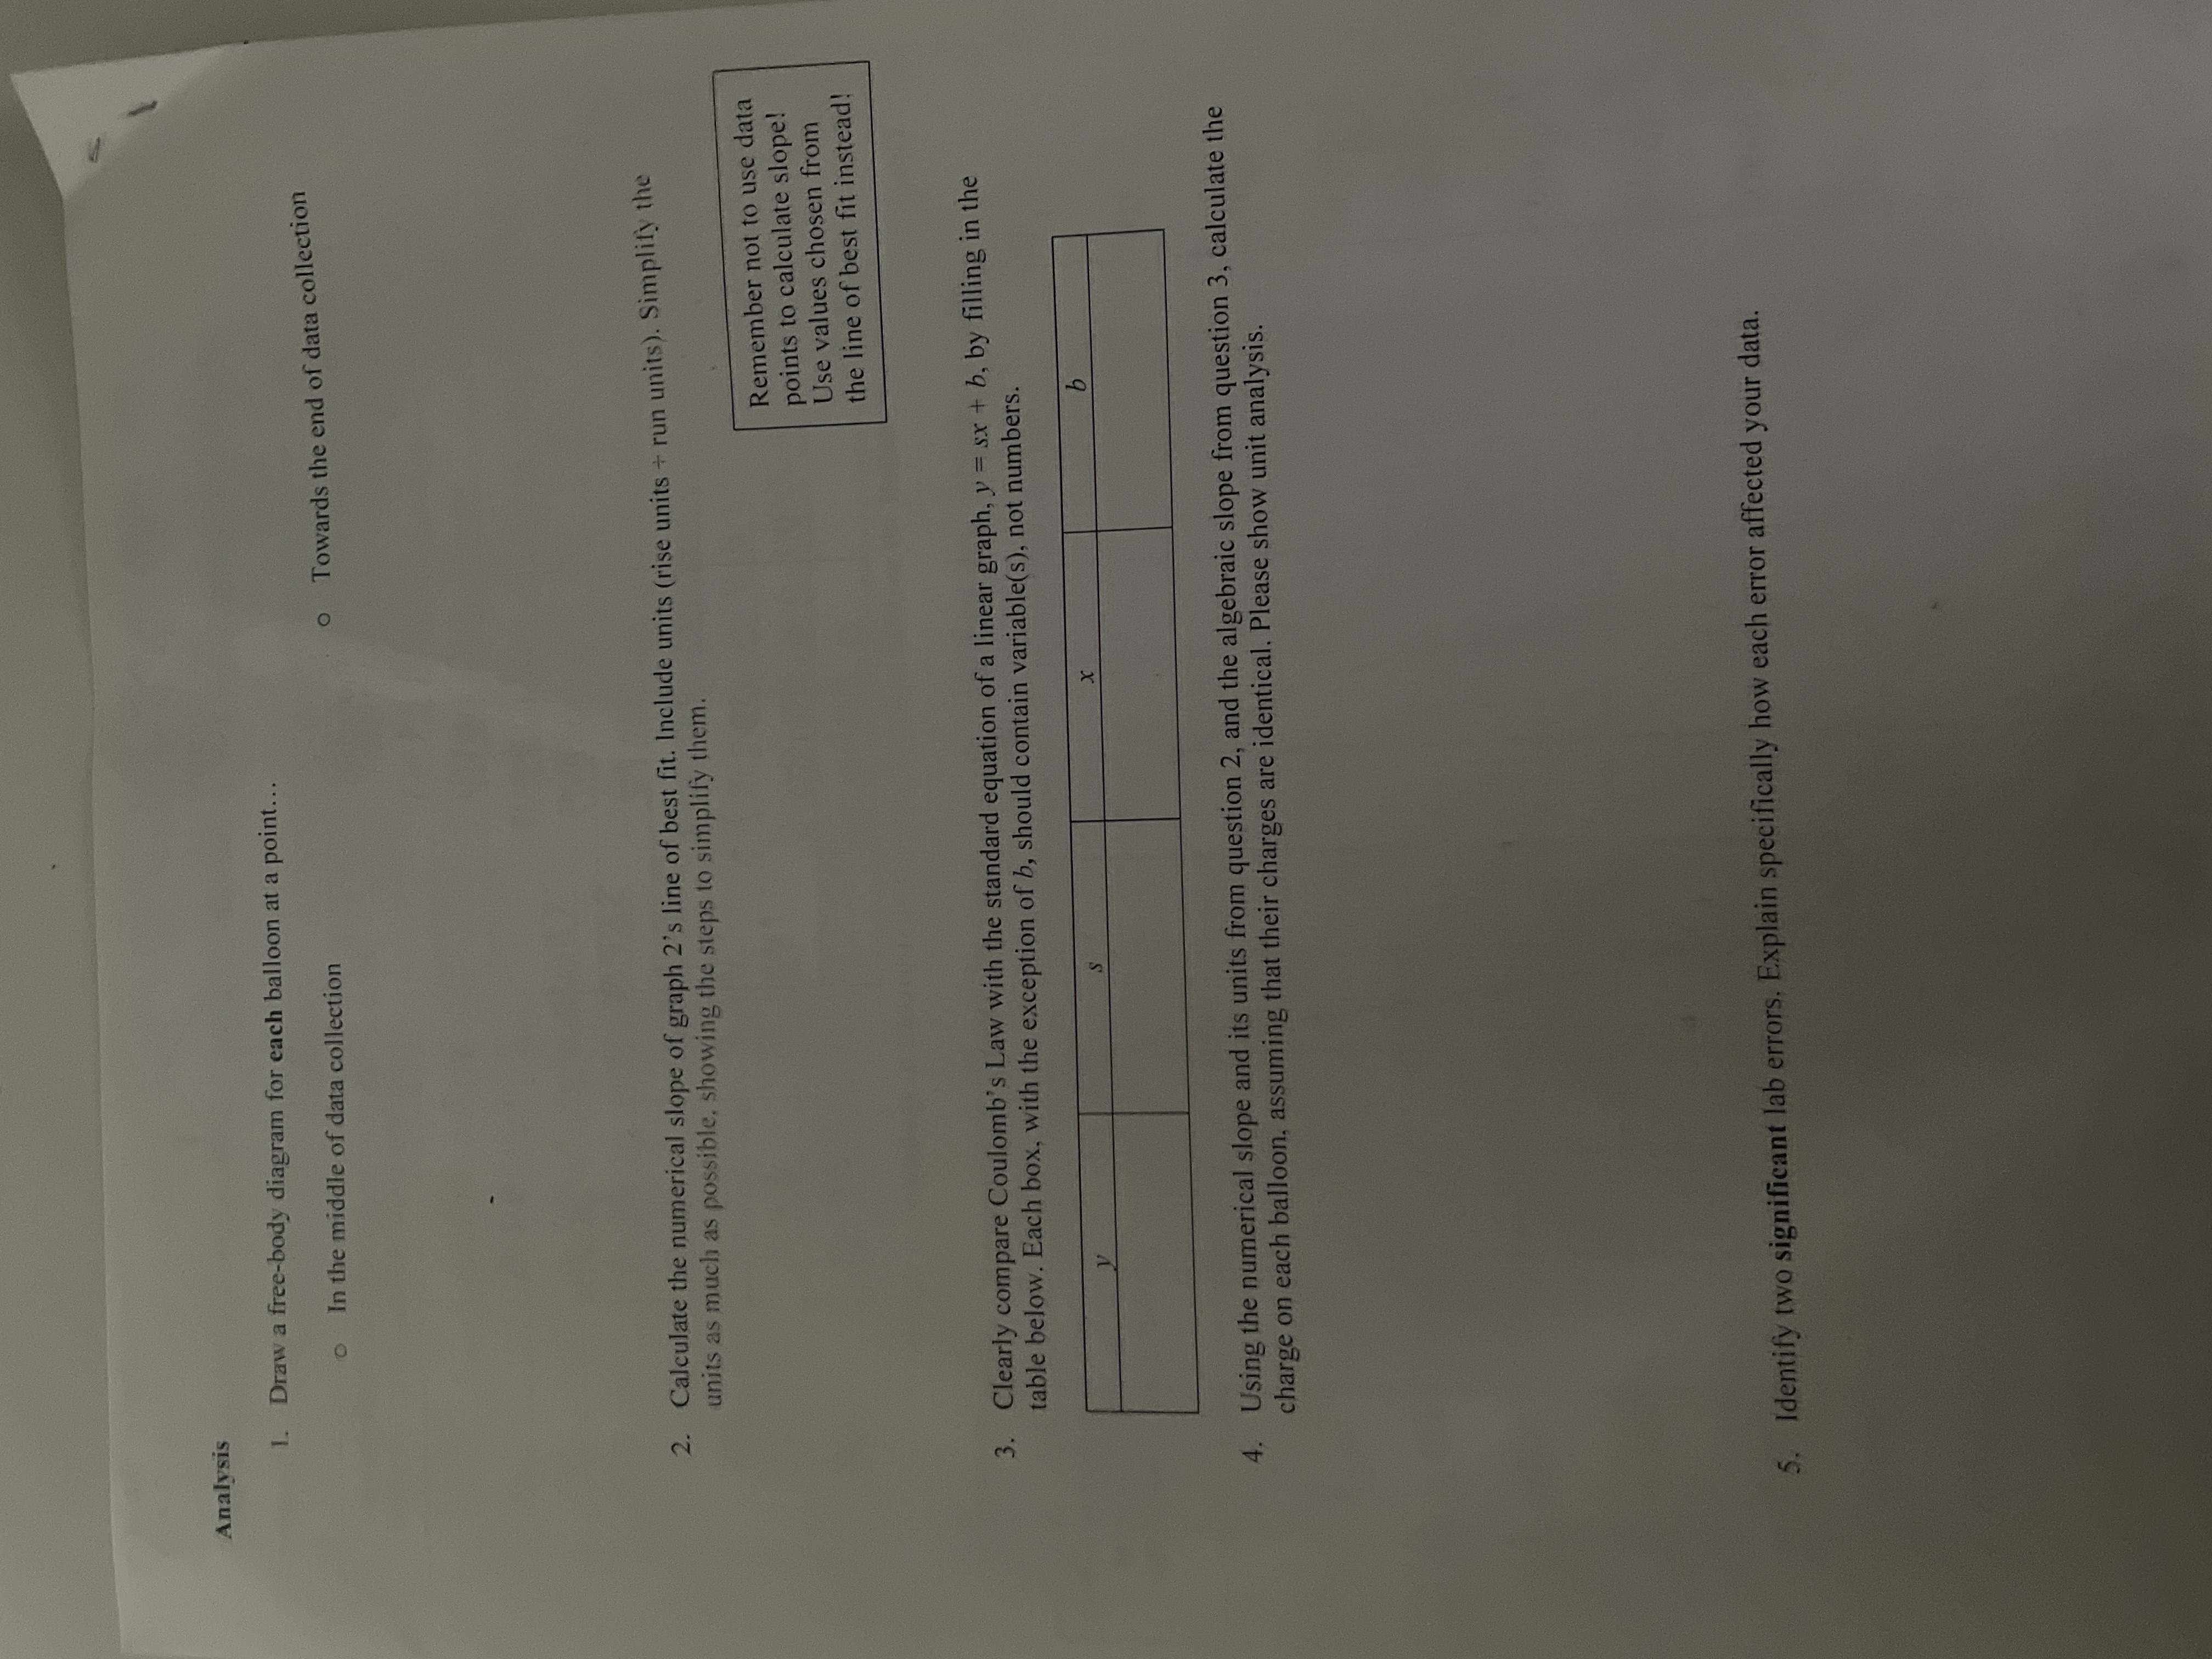
Analysis 1 Analysis 1. Draw a free-body diagram for each balloon at a point... In the middle of data collection Towards the end of data
Analysis 1


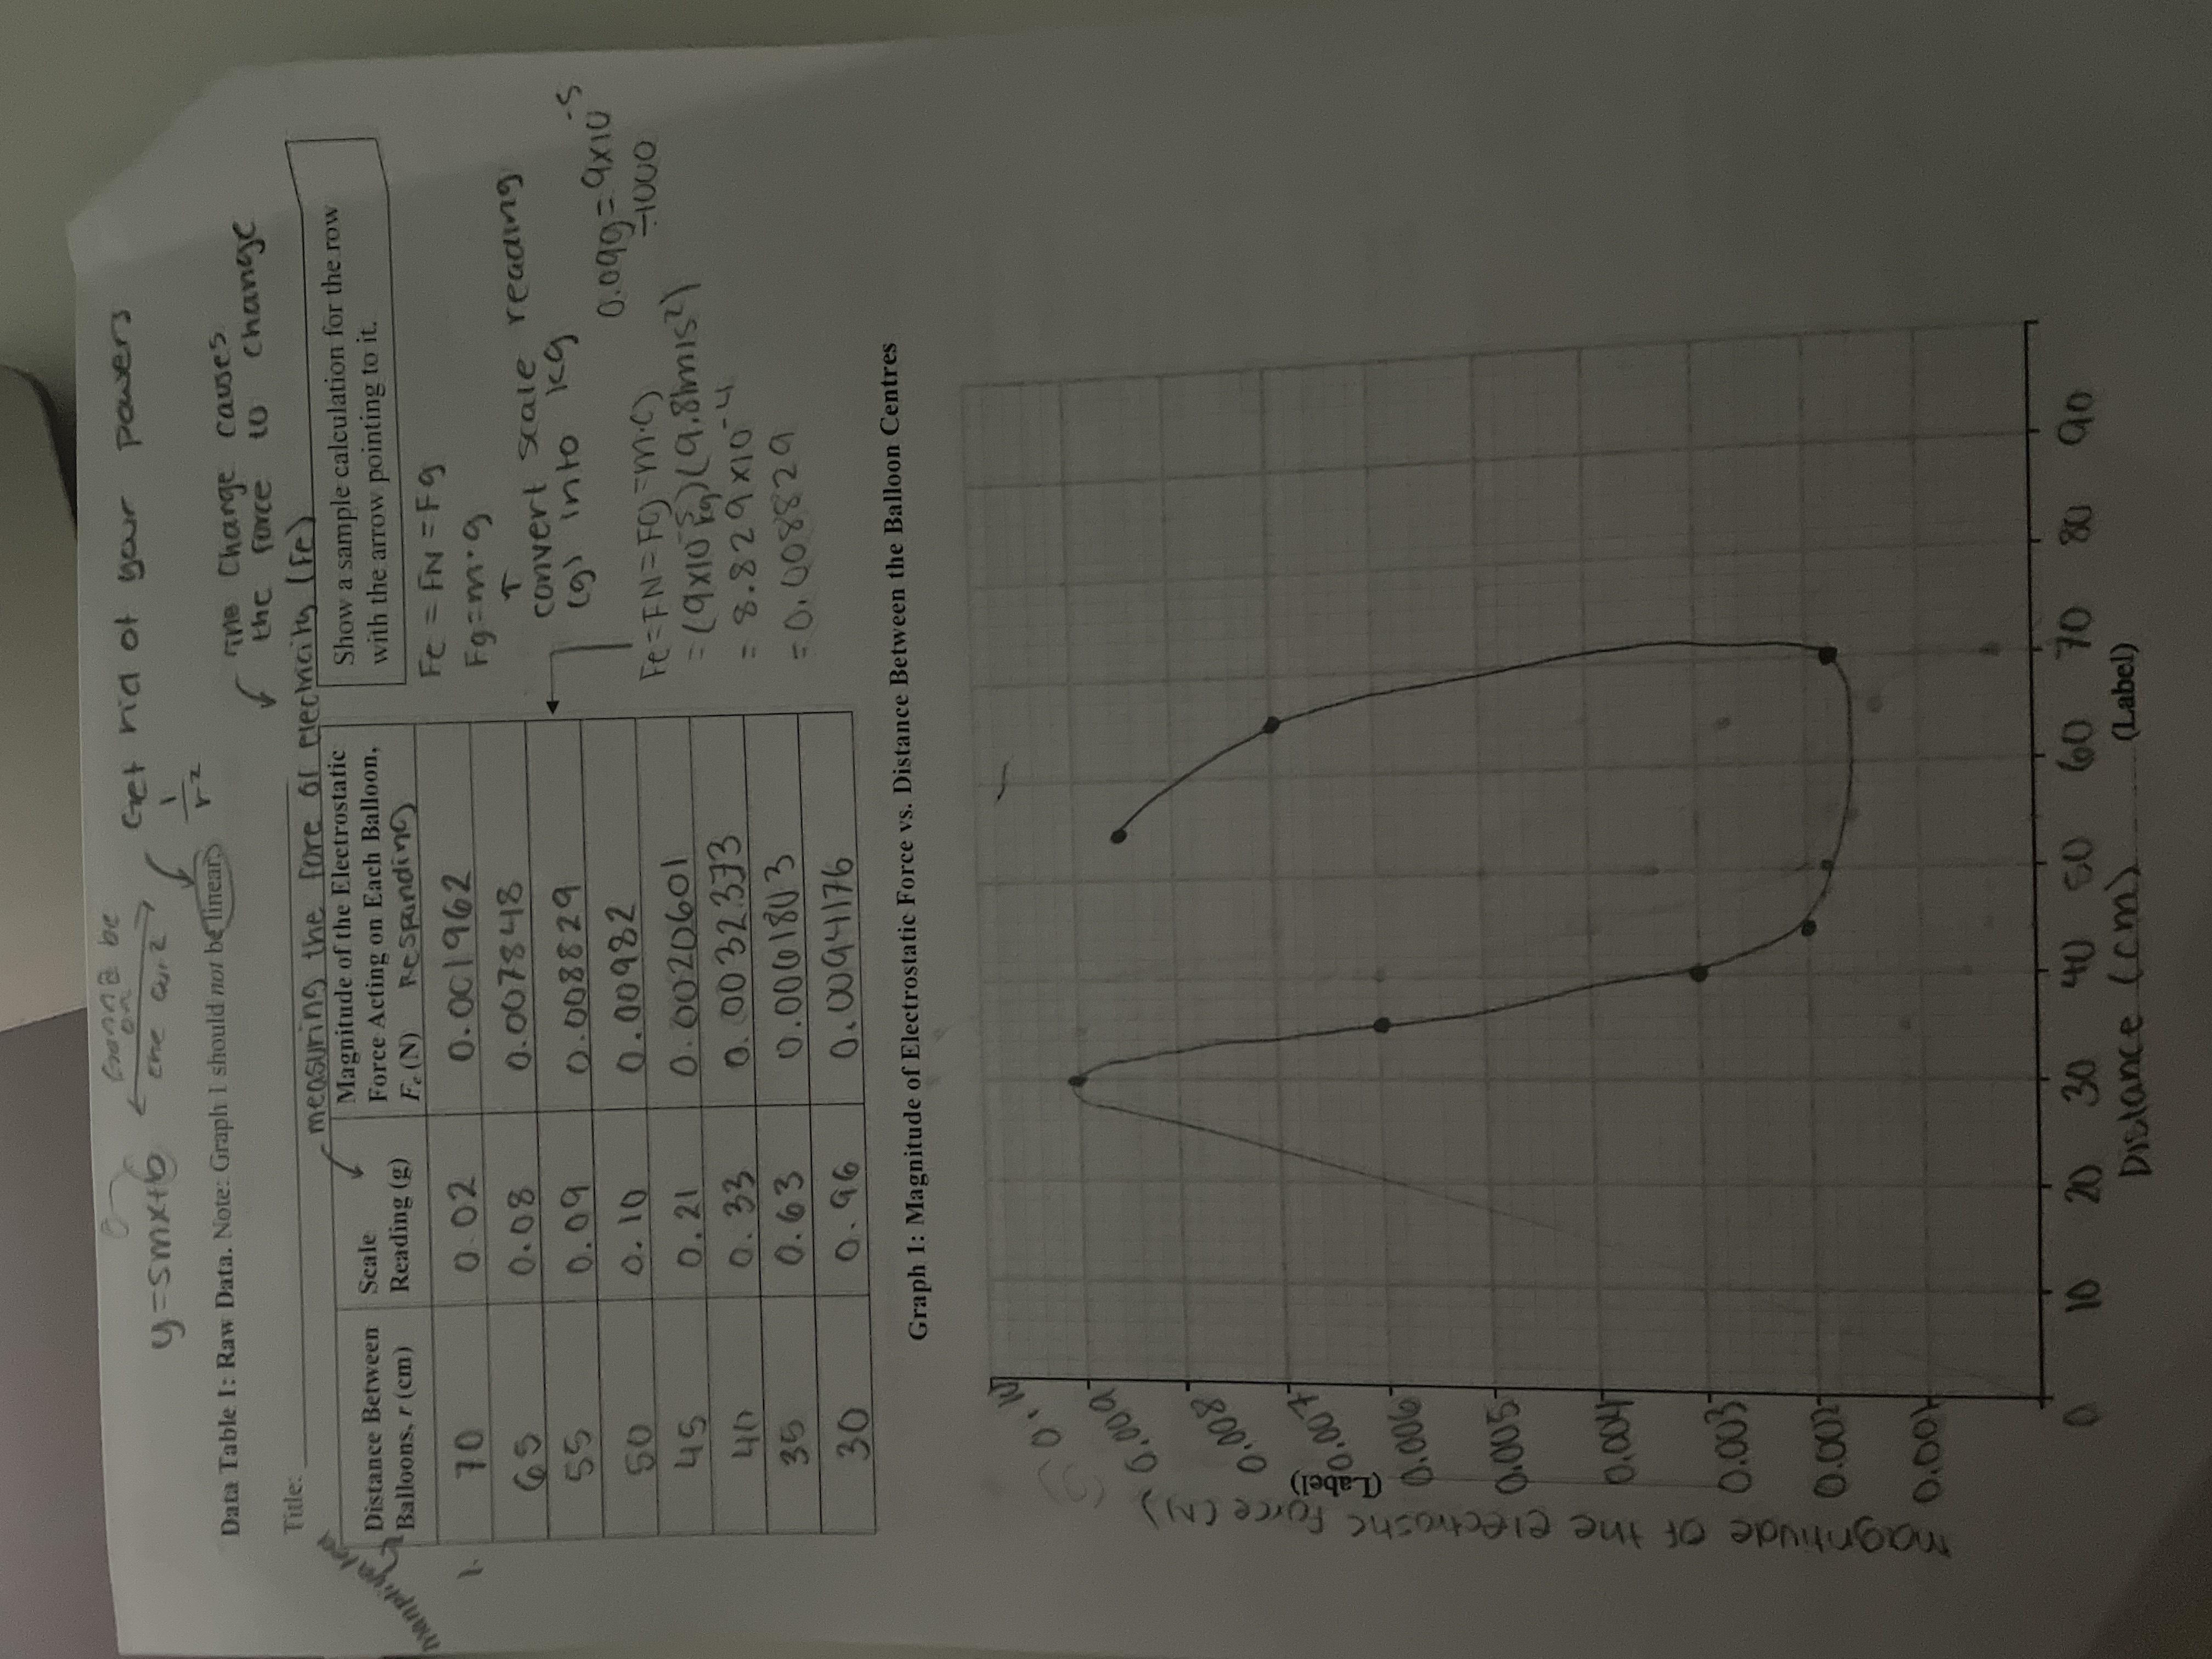
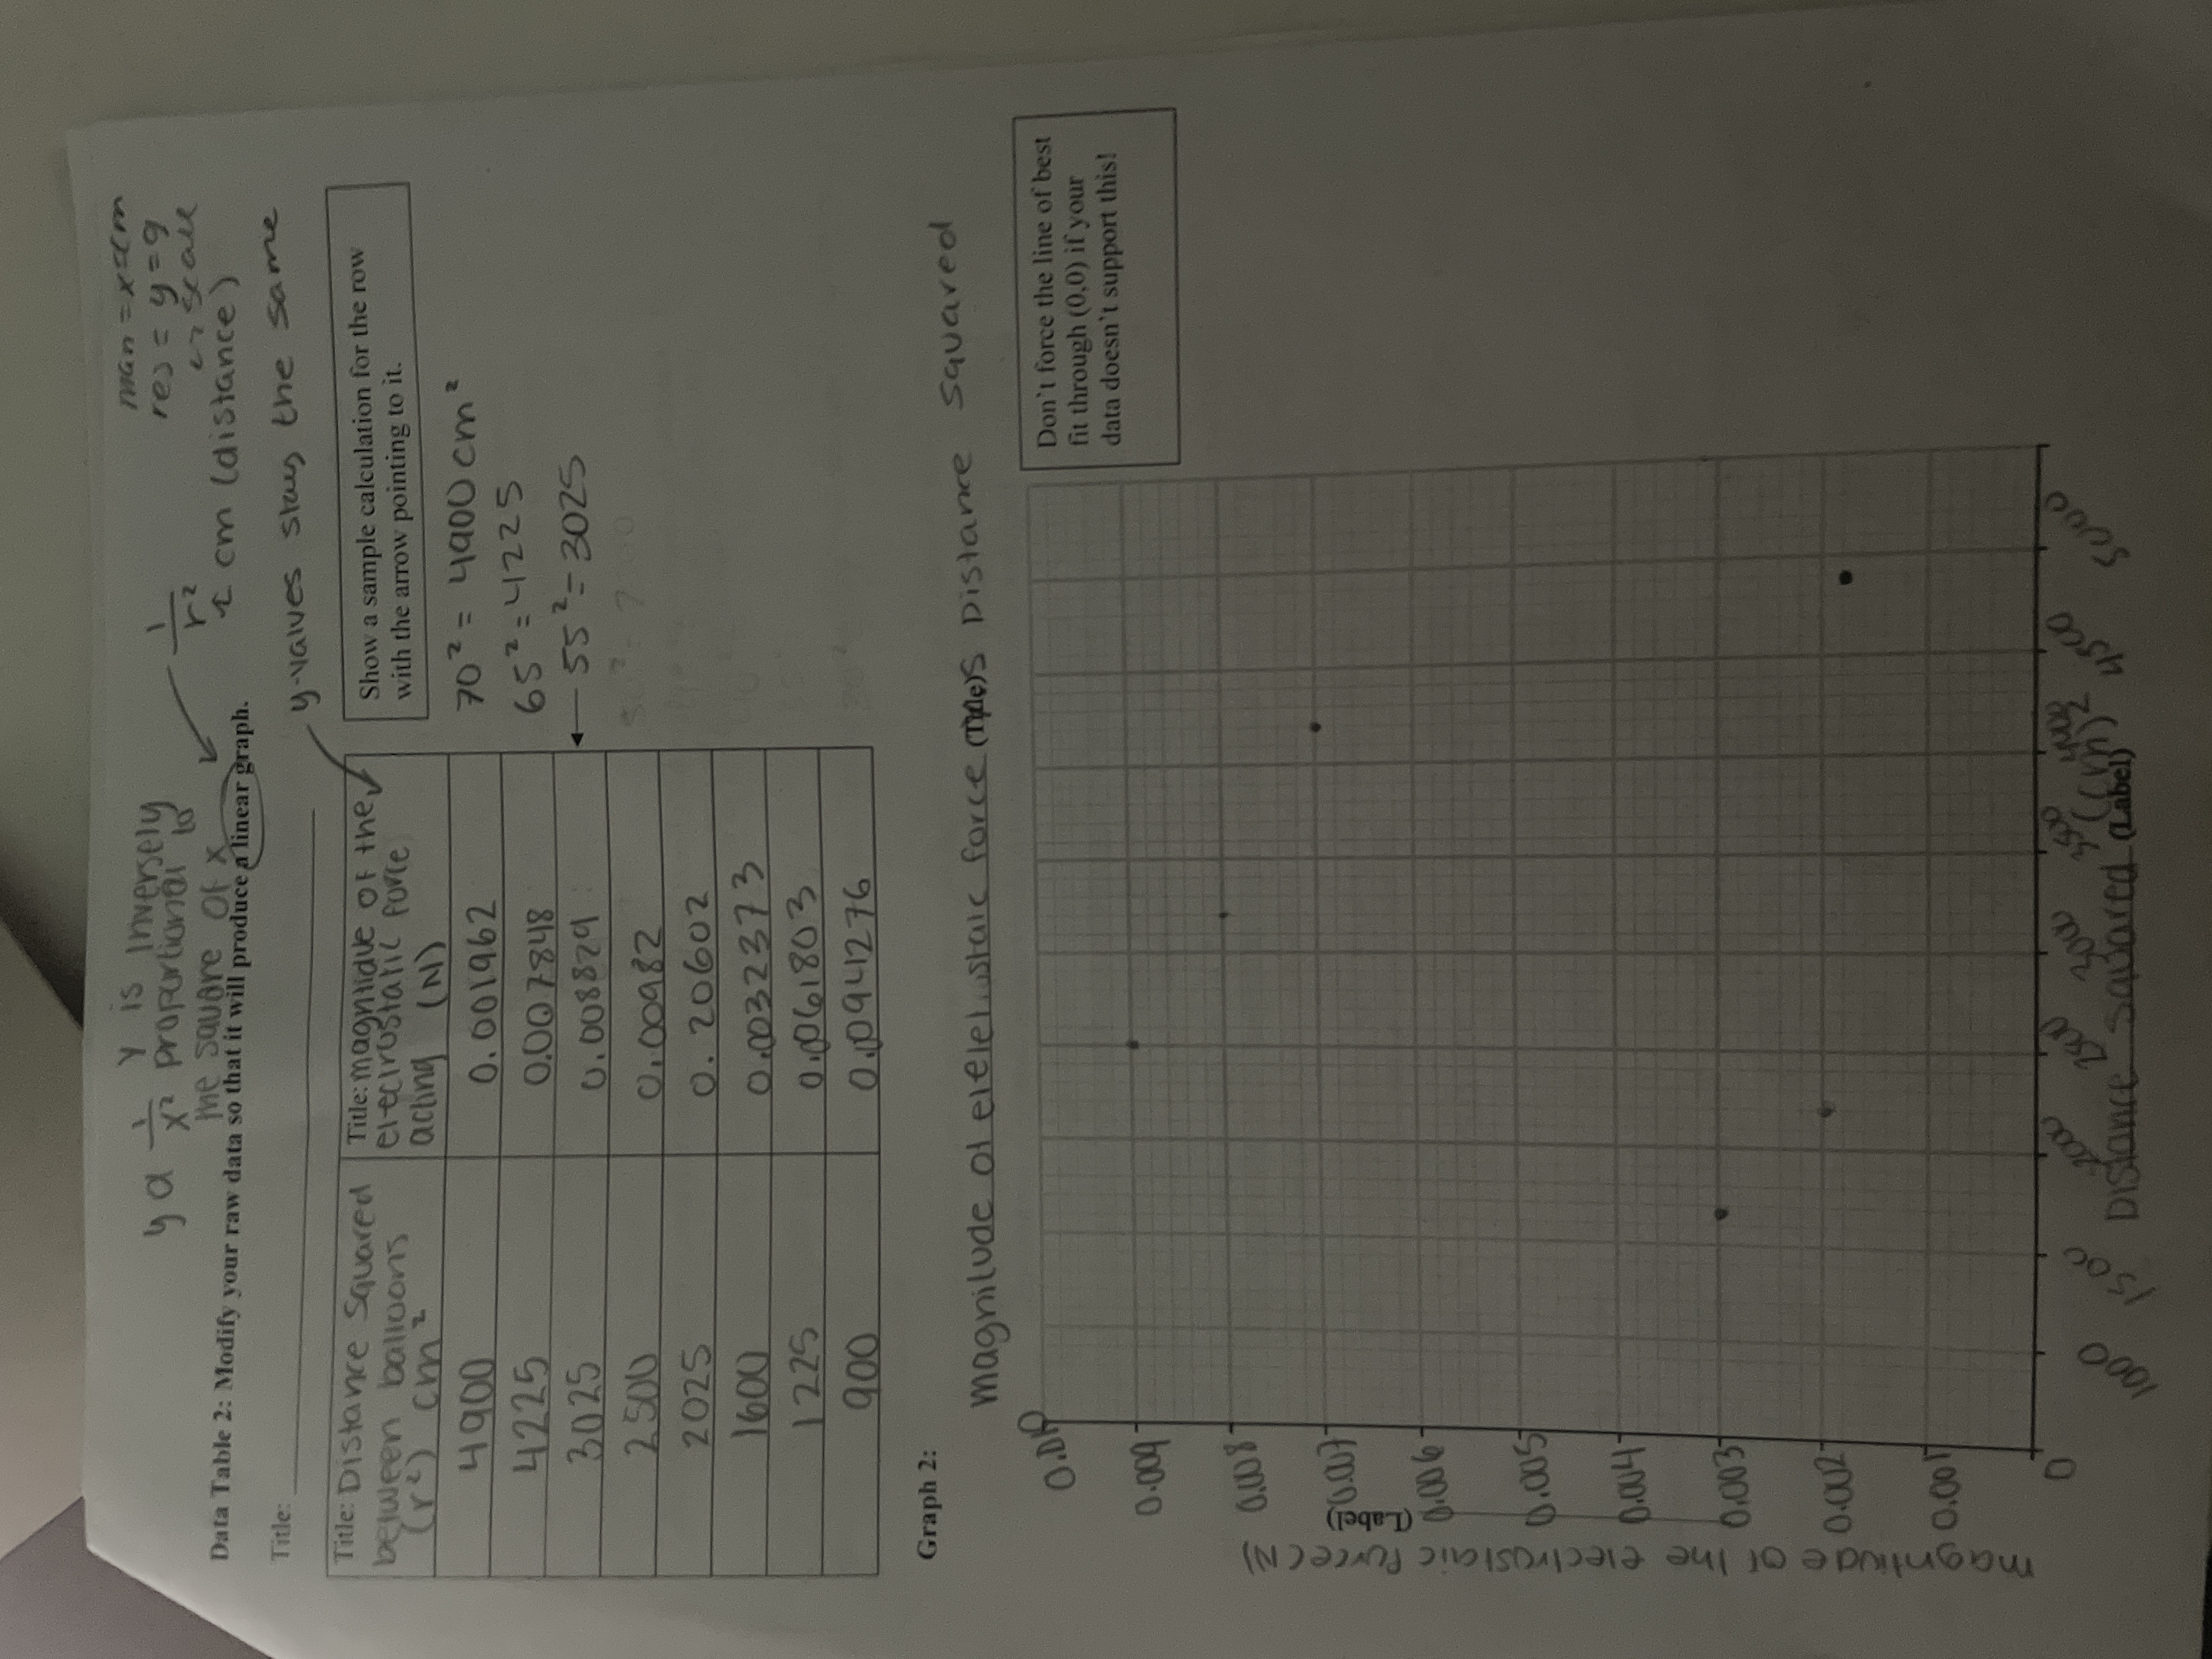
Analysis 1. Draw a free-body diagram for each balloon at a point... In the middle of data collection Towards the end of data collection 2. Calculate the numerical slope of graph 2's line of best fit. Include units (rise units + run units). Simplify the units as much as possible, showing the steps to simplify them. Remember not to use data points to calculate slope! Use values chosen from the line of best fit instead! 3. Clearly compare Coulomb's Law with the standard equation of a linear graph, y = sx + b, by filling in the table below. Each box, with the exception of b, should contain variable(s), not numbers. y S X b 4. Using the numerical slope and its units from question 2, and the algebraic slope from question 3, calculate the charge on each balloon, assuming that their charges are identical. Please show unit analysis. 5. Identify two significant lab errors. Explain specifically how each error affected your data.
Step by Step Solution
There are 3 Steps involved in it
Step: 1

Get Instant Access to Expert-Tailored Solutions
See step-by-step solutions with expert insights and AI powered tools for academic success
Step: 2

Step: 3

Ace Your Homework with AI
Get the answers you need in no time with our AI-driven, step-by-step assistance
Get Started


