Answered step by step
Verified Expert Solution
Question
1 Approved Answer
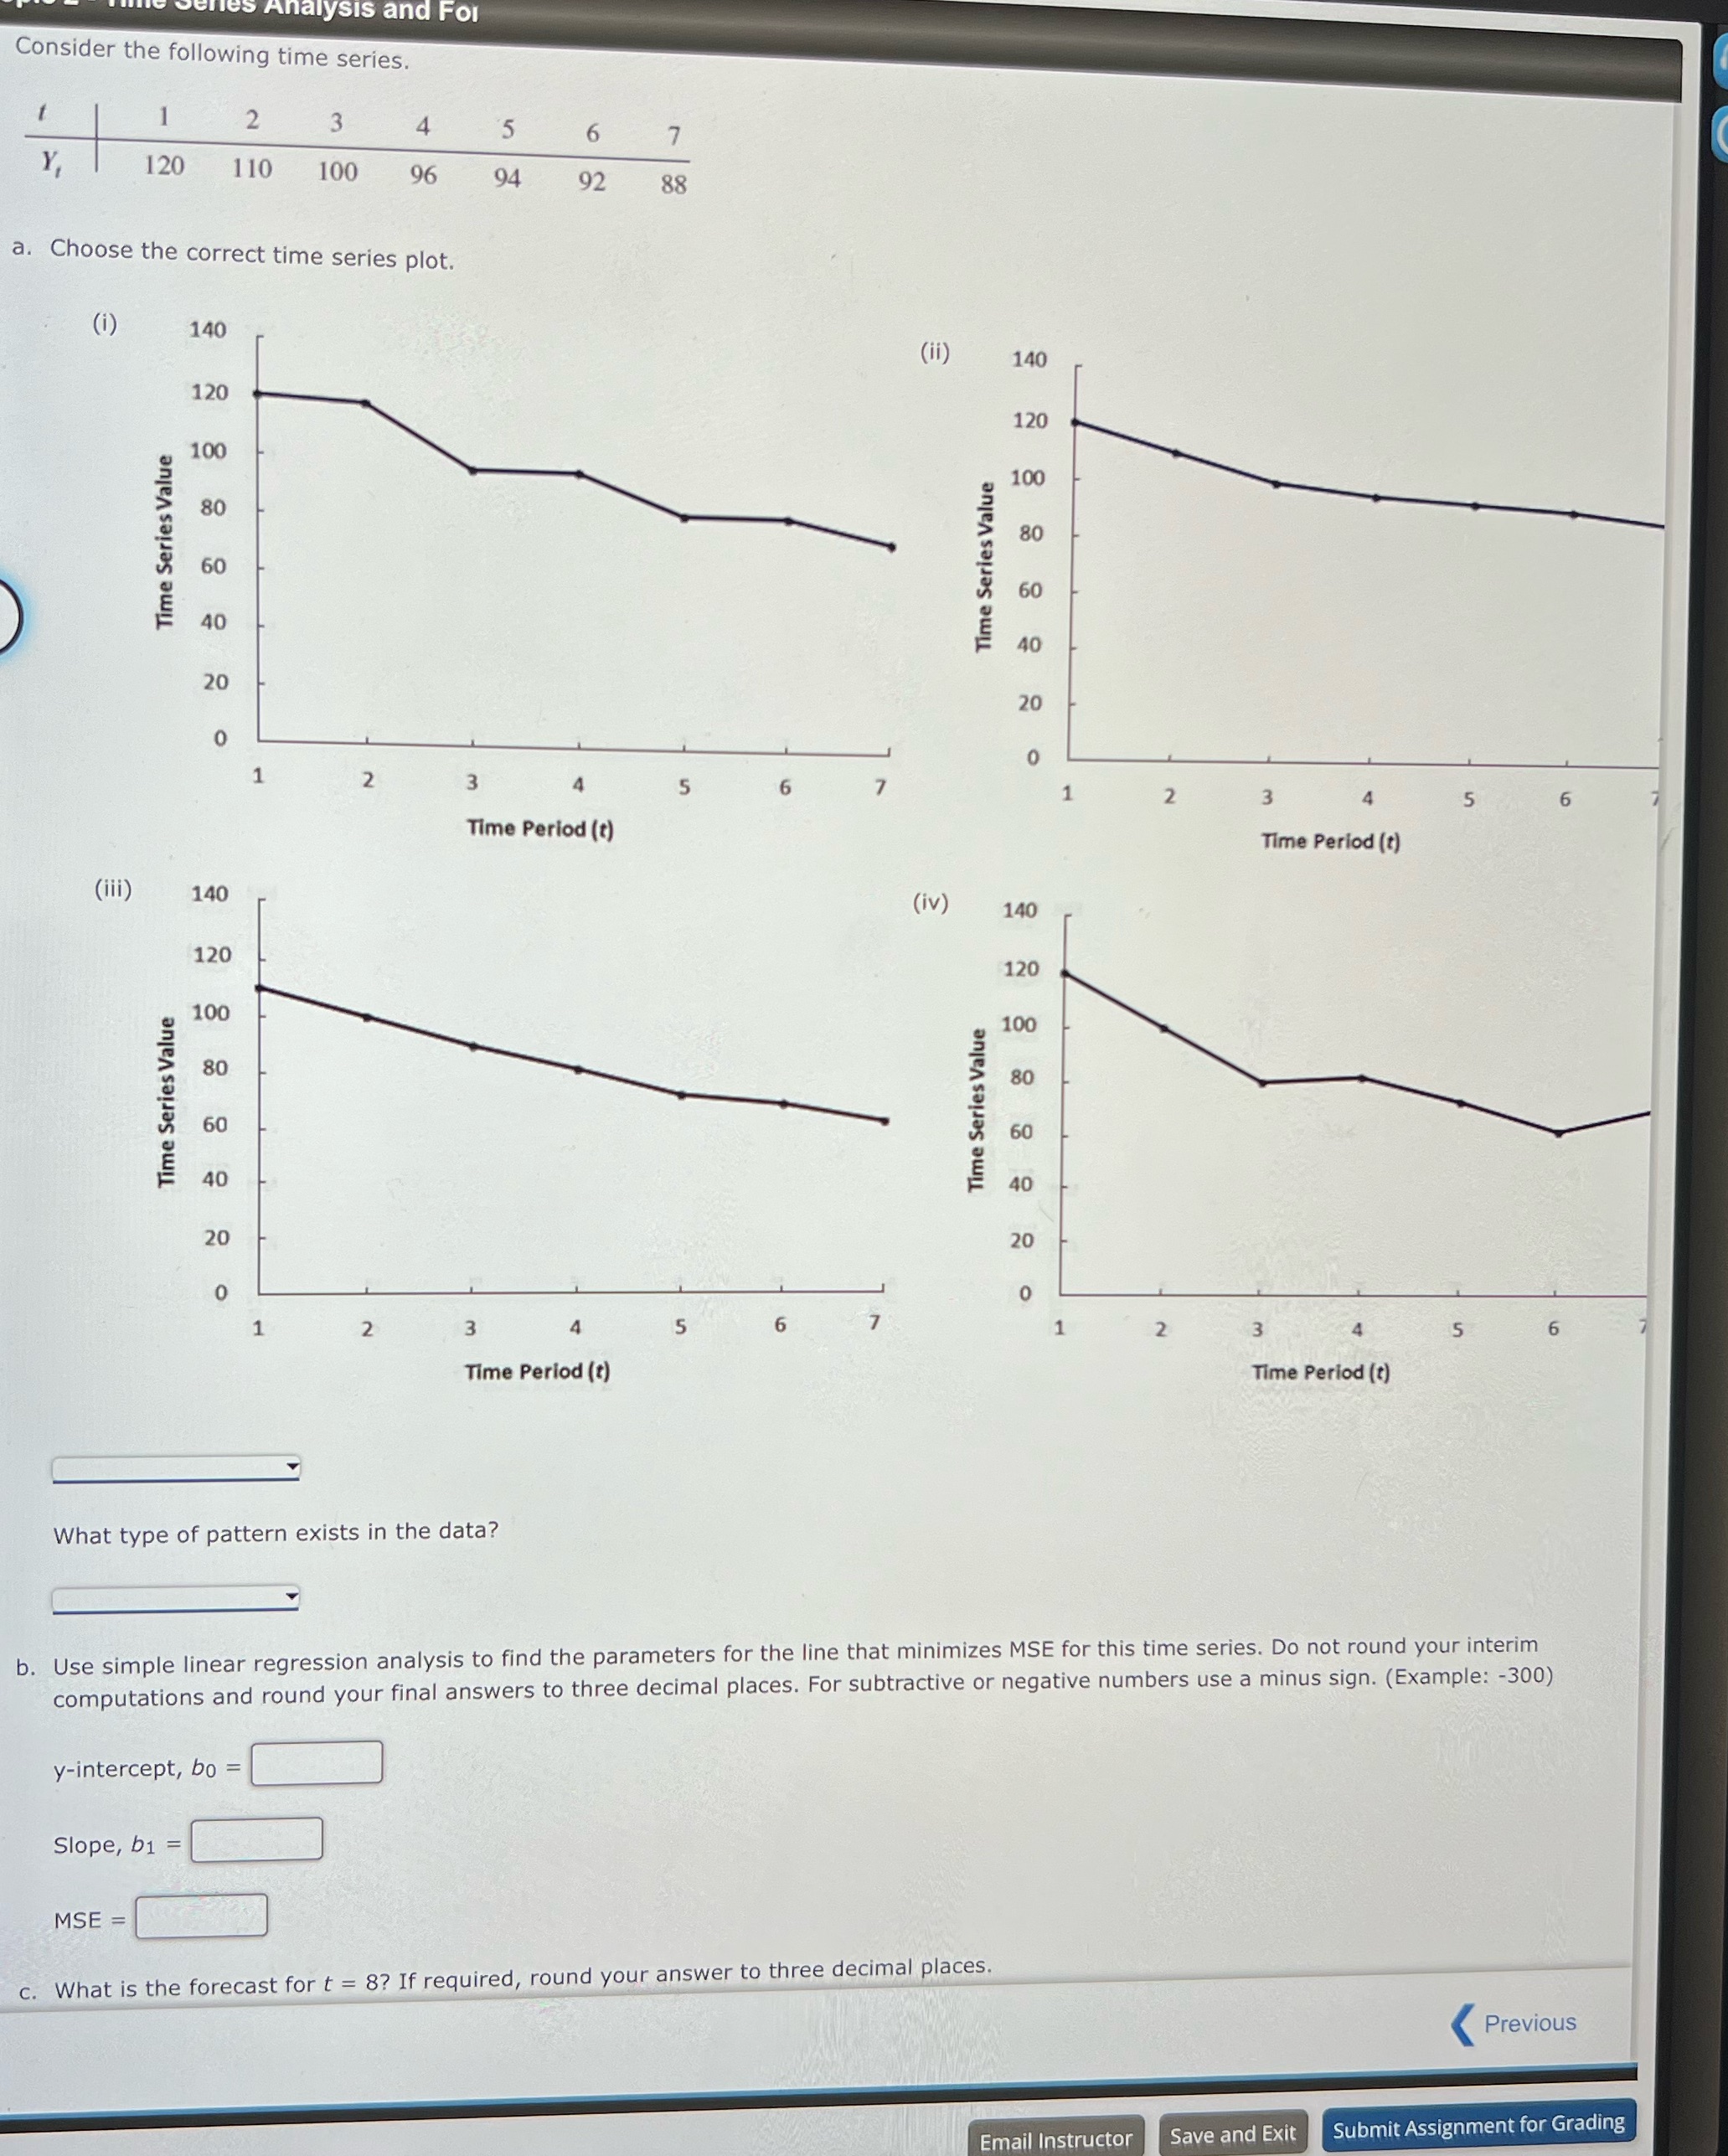
Analysis and For Consider the following time series. 1 2 3 4 5 Y 120 110 100 96 94 62 92 a. Choose the

Analysis and For Consider the following time series. 1 2 3 4 5 Y 120 110 100 96 94 62 92 a. Choose the correct time series plot. (i) 140 Time Series Value (iii) 140 Time Series Value 120 100 80 60 40 20 120 100 80 60 40 20 7 88 88 (ii) 140 Time Series Value 120 100 80 60 40 20 0 0 1 2 3 4 5 6 1 2 3 4 5 6 Time Period (t) (iv) 140 Time Series Value 120 100 80 60 40 20 Time Period (t) 0 0 1 2 3 4 5 6 7 2 3 4 5 6 Time Period (t) Time Period (t) What type of pattern exists in the data? b. Use simple linear regression analysis to find the parameters for the line that minimizes MSE for this time series. Do not round your interim computations and round your final answers to three decimal places. For subtractive or negative numbers use a minus sign. (Example: -300) y-intercept, bo = Slope, b1 = MSE = c. What is the forecast for t = 8? If required, round your answer to three decimal places. Previous Email Instructor Save and Exit Submit Assignment for Grading
Step by Step Solution
There are 3 Steps involved in it
Step: 1

Get Instant Access to Expert-Tailored Solutions
See step-by-step solutions with expert insights and AI powered tools for academic success
Step: 2

Step: 3

Ace Your Homework with AI
Get the answers you need in no time with our AI-driven, step-by-step assistance
Get Started


