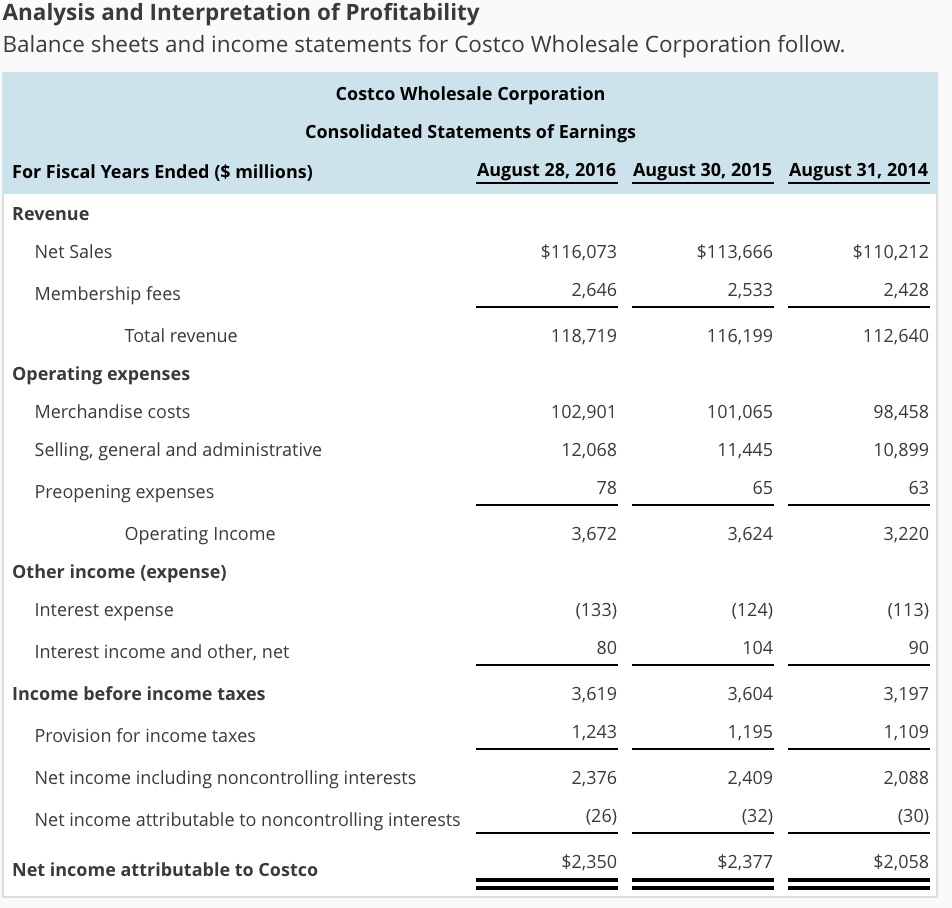
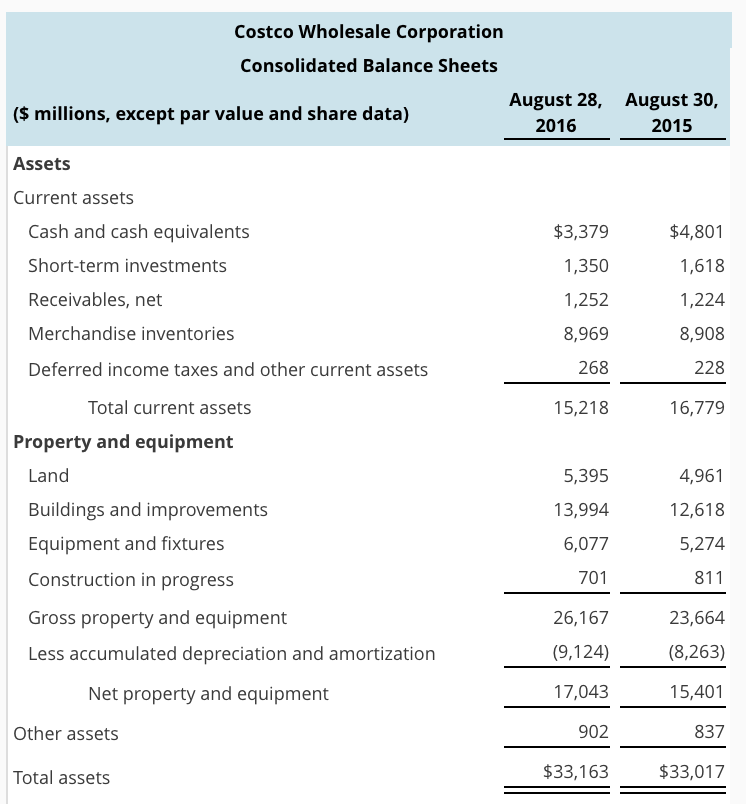
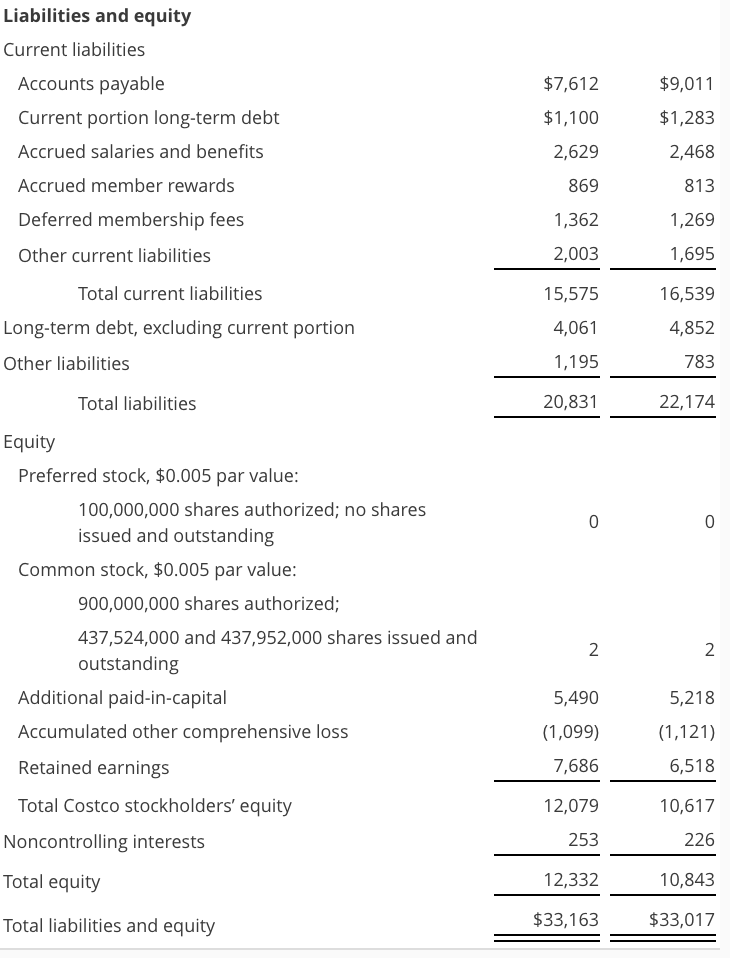
Analysis and Interpretation of Profitability Balance sheets and income statements for Costco Wholesale Corporation follow Costco Wholesale Corporation Consolidated Statements of Earnings For Fiscal Years Ended ($ millions) August 28, 2016 August 30, 2015 August 31, 2014 Revenue $116,073 2,646 118,719 $113,666 2,533 116,199 Net Sales $110,212 2,428 112,640 Membership fees Total revenue Operating expenses Merchandise costs Selling, general and administrative Preopening expenses 102,901 12,068 78 3,672 101,065 11,445 65 3,624 98,458 10,899 63 3,220 Operating Income Other income (expense) (124) 104 3,604 1,195 2,409 (32) $2,377 Interest expense (133) 80 3,619 1,243 2376 (26) $2,350 (113) 90 3,197 1,109 2,088 (30) $2,058 Interest income and other, net Income before income taxes Provision for income taxes Net income including noncontrolling interests Net income attributable to noncontrolling interests Net income attributable to Costco Costco Wholesale Corporation Consolidated Balance Sheets August 28, 2016 August 30, 2015 ($ millions, except par value and share data) Assets Current assets Cash and cash equivalents Short-term investments Receivables, net Merchandise inventories Deferred income taxes and other current assets $3,379 1,350 1,252 8,969 268 15,218 $4,801 1,618 1,224 8,908 228 16,779 Total current assets Property and equipment Land Buildings and improvements Equipment and fixtures Construction in progress Gross property and equipment Less accumulated depreciation and amortization 5,395 13,994 6,077 701 26,167 (9,124) 17,043 902 $33,163 4,961 12,618 5,274 811 23,664 (8,263) 15,401 837 $33,017 Net property and equipment Other assets Total assets Liabilities and equity Current liabilities Accounts payable Current portion long-term debt Accrued salaries and benefits Accrued member rewards Deferred membership fees Other current liabilities $7,612 $1,100 2,629 869 1,362 2,003 15,575 4,061 1,195 20,831 $9,011 $1,283 2,468 813 1,269 1,695 16,539 4,852 783 22,174 Total current liabilities Long-term debt, excluding current portion Other liabilities Total liabilities Equity Preferred stock, $0.005 par value 100,000,000 shares authorized; no shares issued and outstanding Common stock, $0.005 par value 900,000,000 shares authorized; 437,524,000 and 437,952,000 shares issued and outstanding 2 5,490 (1,099) 7,686 12,079 253 12,332 $33,163 2 5,218 (1,121) 6,518 10,617 226 10,843 $33,017 Additional paid-in-capital Accumulated other comprehensive loss Retained earnings Total Costco stockholders' equity Noncontrolling interests Total equity Total liabilities and equity d) Compute net nonoperating obligations (NNO) for 2016 and 2015. 2016 NNO 2015 NNO x ($ millions) x($ millions) (e) Compute return on equity (ROE) for 2016. (Do not round until final answer. Round answer two decimal places) 2016 ROE x% (f) Infer the nonoperating return component of ROE for 2016. (Use answers from above to calculate. Round two decimal places.) Analysis and Interpretation of Profitability Balance sheets and income statements for Costco Wholesale Corporation follow Costco Wholesale Corporation Consolidated Statements of Earnings For Fiscal Years Ended ($ millions) August 28, 2016 August 30, 2015 August 31, 2014 Revenue $116,073 2,646 118,719 $113,666 2,533 116,199 Net Sales $110,212 2,428 112,640 Membership fees Total revenue Operating expenses Merchandise costs Selling, general and administrative Preopening expenses 102,901 12,068 78 3,672 101,065 11,445 65 3,624 98,458 10,899 63 3,220 Operating Income Other income (expense) (124) 104 3,604 1,195 2,409 (32) $2,377 Interest expense (133) 80 3,619 1,243 2376 (26) $2,350 (113) 90 3,197 1,109 2,088 (30) $2,058 Interest income and other, net Income before income taxes Provision for income taxes Net income including noncontrolling interests Net income attributable to noncontrolling interests Net income attributable to Costco Costco Wholesale Corporation Consolidated Balance Sheets August 28, 2016 August 30, 2015 ($ millions, except par value and share data) Assets Current assets Cash and cash equivalents Short-term investments Receivables, net Merchandise inventories Deferred income taxes and other current assets $3,379 1,350 1,252 8,969 268 15,218 $4,801 1,618 1,224 8,908 228 16,779 Total current assets Property and equipment Land Buildings and improvements Equipment and fixtures Construction in progress Gross property and equipment Less accumulated depreciation and amortization 5,395 13,994 6,077 701 26,167 (9,124) 17,043 902 $33,163 4,961 12,618 5,274 811 23,664 (8,263) 15,401 837 $33,017 Net property and equipment Other assets Total assets Liabilities and equity Current liabilities Accounts payable Current portion long-term debt Accrued salaries and benefits Accrued member rewards Deferred membership fees Other current liabilities $7,612 $1,100 2,629 869 1,362 2,003 15,575 4,061 1,195 20,831 $9,011 $1,283 2,468 813 1,269 1,695 16,539 4,852 783 22,174 Total current liabilities Long-term debt, excluding current portion Other liabilities Total liabilities Equity Preferred stock, $0.005 par value 100,000,000 shares authorized; no shares issued and outstanding Common stock, $0.005 par value 900,000,000 shares authorized; 437,524,000 and 437,952,000 shares issued and outstanding 2 5,490 (1,099) 7,686 12,079 253 12,332 $33,163 2 5,218 (1,121) 6,518 10,617 226 10,843 $33,017 Additional paid-in-capital Accumulated other comprehensive loss Retained earnings Total Costco stockholders' equity Noncontrolling interests Total equity Total liabilities and equity d) Compute net nonoperating obligations (NNO) for 2016 and 2015. 2016 NNO 2015 NNO x ($ millions) x($ millions) (e) Compute return on equity (ROE) for 2016. (Do not round until final answer. Round answer two decimal places) 2016 ROE x% (f) Infer the nonoperating return component of ROE for 2016. (Use answers from above to calculate. Round two decimal places.)