Answered step by step
Verified Expert Solution
Question
1 Approved Answer
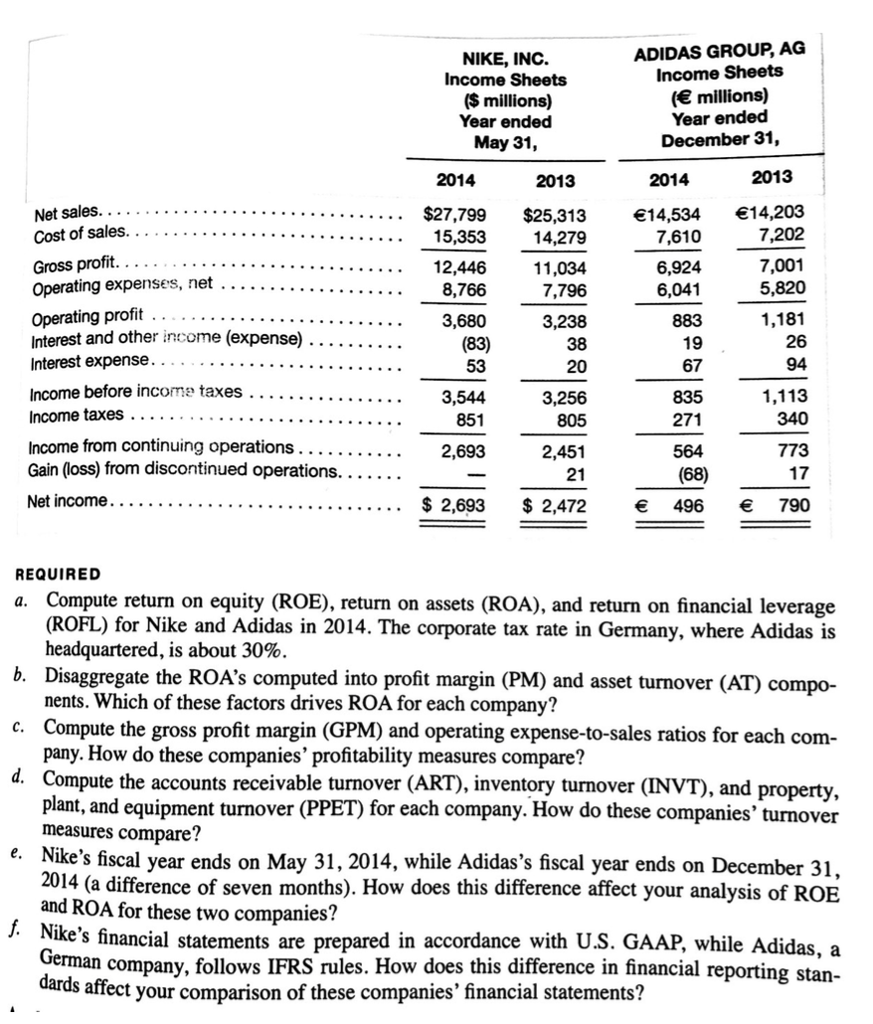
Analysis and Interpretation of Return on Investment for Competitors Balance sheets and income statements for Nike, Inc., and Adidas Group follow fi P5-36. Refer to
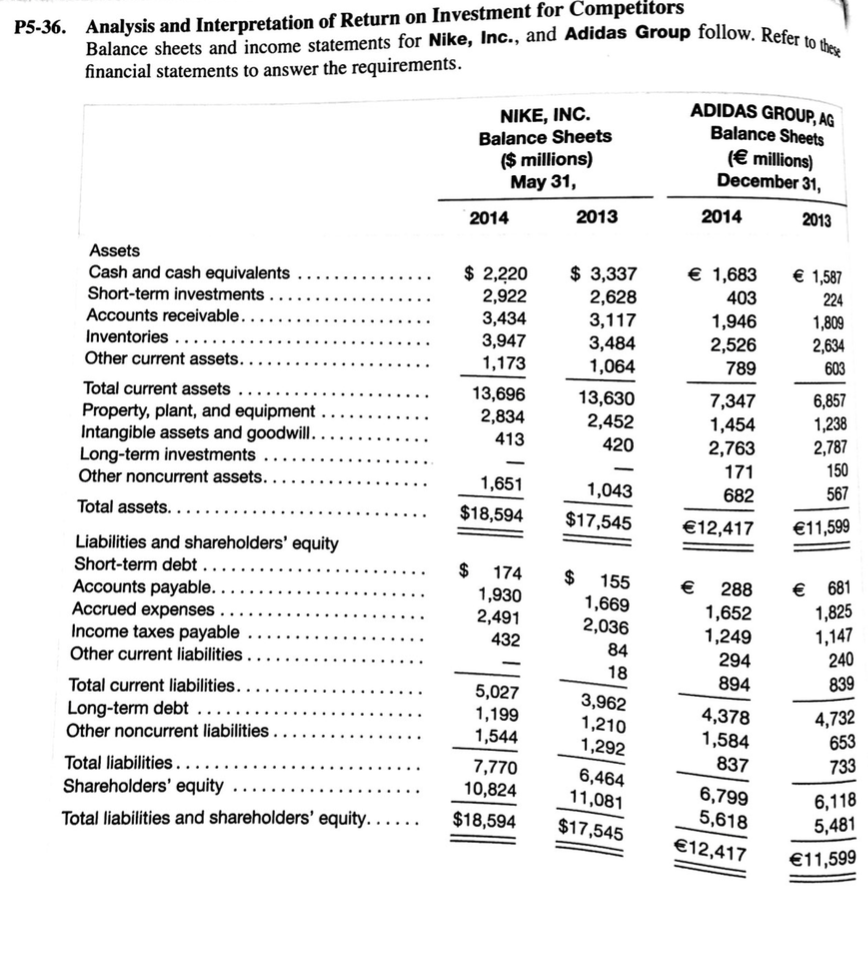
Analysis and Interpretation of Return on Investment for Competitors Balance sheets and income statements for Nike, Inc., and Adidas Group follow fi P5-36. Refer to thee. nancial statements to answer the requirements. NIKE, INC. Balance Sheets $ millions) May 31, ADIDAS GROUP, AG Balance Sheets ( millions) December 31, 2014 2013 2014 2013 Assets $2,220 3,3371,683 1,587 2,922 3,434 3,947 1,173 13,696 2,834 413 2,628 3,117 3,484 1,064 13,630 2,452 420 403 1,946 2,526 789 Accounts receivable. 1,809 2,634 603 6,857 1,238 2,787 . Total current assets 7,347 1,454 2,763 Long-term investments . 1,651 1,043 $18,594 $17,545 682 12,417 11,599 Liabilities and shareholders' equity 1,930 2,491 432 1,669 2,036 84 288 1,652 1,249 294 894 681 1,825 1,147 240 expenses. Income taxes payable Other current liabilities... . . 3,962 1,210 1,292 6,464 11,081 $18,594$17,545 5,027 1,199 1,544 7,770 4,378 1,584 837 6,799 4,732 653 733 Total liabilities. . . . 5,618 5, 12,417 11,599 5,481
Step by Step Solution
There are 3 Steps involved in it
Step: 1
Get Instant Access to Expert-Tailored Solutions
See step-by-step solutions with expert insights and AI powered tools for academic success
Step: 2
Step: 3
Ace Your Homework with AI
Get the answers you need in no time with our AI-driven, step-by-step assistance
Get Started