Answered step by step
Verified Expert Solution
Question
1 Approved Answer
Analysis of Carbig.mato vio BAITAM Assignment dontist Part 2 I boobs Write a MATLAB program (script) that loads in the carbig.mat dataset and which
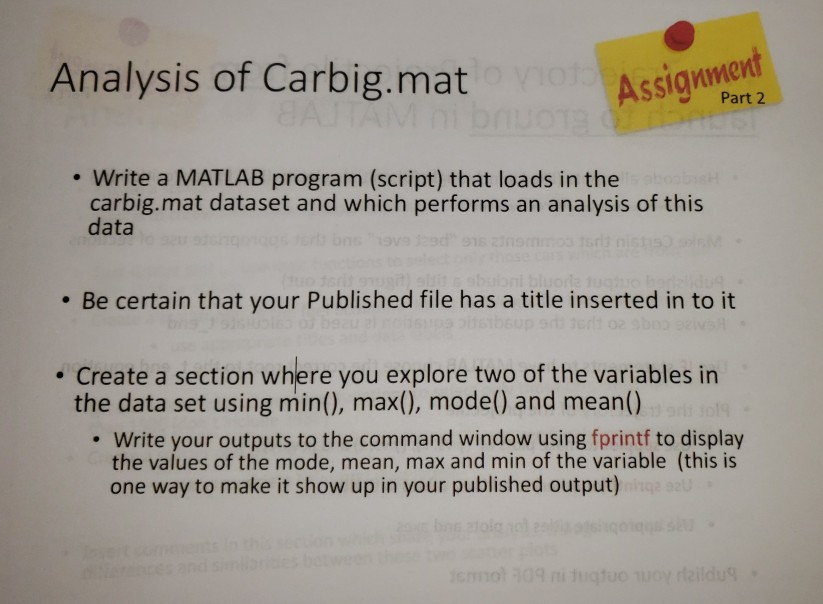
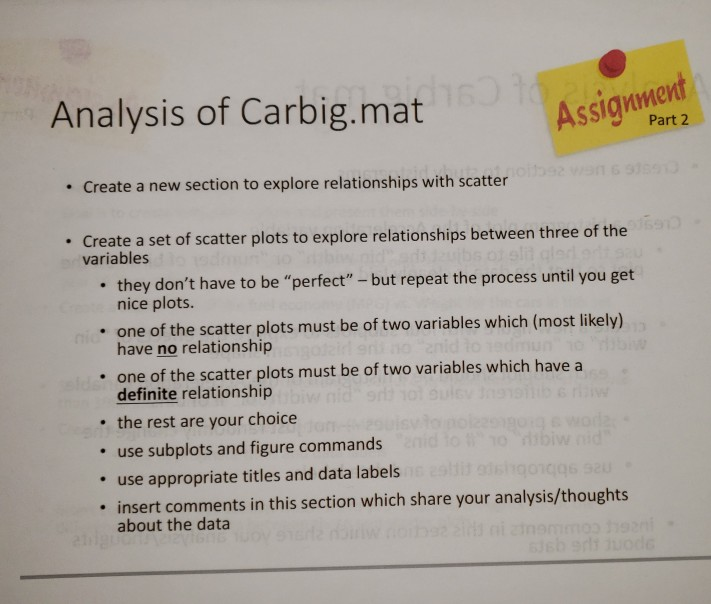
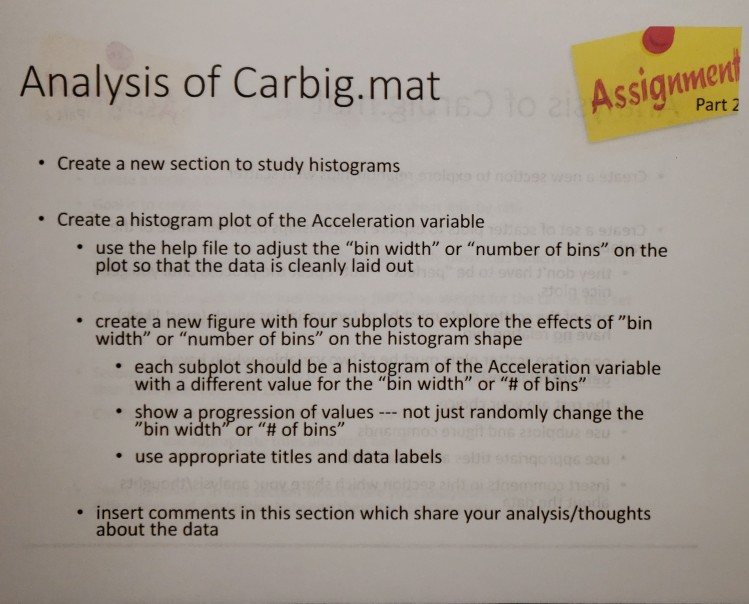
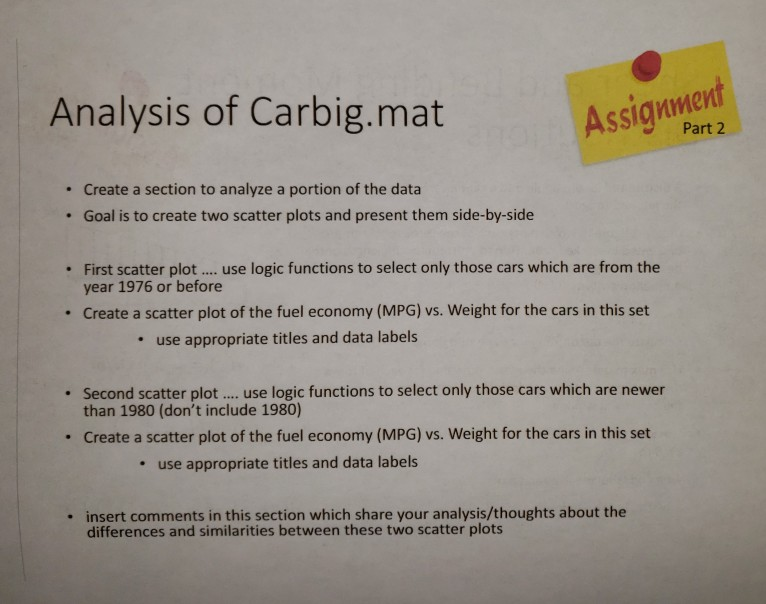
Analysis of Carbig.mato vio BAITAM Assignment dontist Part 2 I boobs Write a MATLAB program (script) that loads in the carbig.mat dataset and which performs an analysis of this data shubni blud e fugh Be certain that your Published file has a title inserted in to it Create a section where you explore two of the variables in the data set using min(), max(), mode() and mean() Write your outputs to the command window using fprintf to display the values of the mode, mean, max and min of the variable (this is one way to make it show up in your published output) qe 92U differences jennol 309 ni fuqtuo w raildu is machs pics) to Analysis of Carbig.mat utanin Create a new section to explore relationships with scatter Assignment Part 2 515910 Create a set of scatter plots to explore relationships between three of the variables o 15dmun" so izujbs of slit glad.odt sa they don't have to be "perfect" - but repeat the process until you get nice plots. . one of the scatter plots must be of two variables which (most likely) have no relationship no anid one of the scatter plots must be of two variables which have a definite relationship the rest are your choice use subplots and figure commands an use appropriate titles and data labels insert comments in this section which share your analysis/thoughts about the data no dibiw nid" Ishqoqqs 920 sjeb srit juode Analysis of Carbig.mat to 2 Assignment Create a new section to study histograms . . Create a histogram plot of the Acceleration variable use the help file to adjust the "bin width" or "number of bins" on the plot so that the data is cleanly laid out create a new figure with four subplots to explore the effects of "bin width" or "number of bins" on the histogram shape OVEN each subplot should be a histogram of the Acceleration variable with a different value for the "bin width" or "# of bins" show a progression of values --- not just randomly change the "bin width" or "# of bins" absmmoo shught bns atolo use appropriate titles and data labels insert comments in this section which share your analysis/thoughts about the data Part 2 Analysis of Carbig.mat Create a section to analyze a portion of the data Goal is to create two scatter plots and present them side-by-side . o Assignment First scatter plot.... use logic functions to select only those cars which are from the year 1976 or before Create a scatter plot of the fuel economy (MPG) vs. Weight for the cars in this set use appropriate titles and data labels . . Second scatter plot.... use logic functions to select only those cars which are newer than 1980 (don't include 1980) Create a scatter plot of the fuel economy (MPG) vs. Weight for the cars in this set use appropriate titles and data labels . Part 2 insert comments in this section which share your analysis/thoughts about the differences and similarities between these two scatter plots
Step by Step Solution
★★★★★
3.51 Rating (158 Votes )
There are 3 Steps involved in it
Step: 1
Hey Note Brother if you have any queries related the answer please ...
Get Instant Access to Expert-Tailored Solutions
See step-by-step solutions with expert insights and AI powered tools for academic success
Step: 2

Step: 3

Ace Your Homework with AI
Get the answers you need in no time with our AI-driven, step-by-step assistance
Get Started


