Answered step by step
Verified Expert Solution
Link Copied!

Question

1 Approved Answer

Analysis of Financial Statement Data The following data were taken from the financial statements of The Mann Corporation. 2012 2013 Net sales Net income $1,500,000
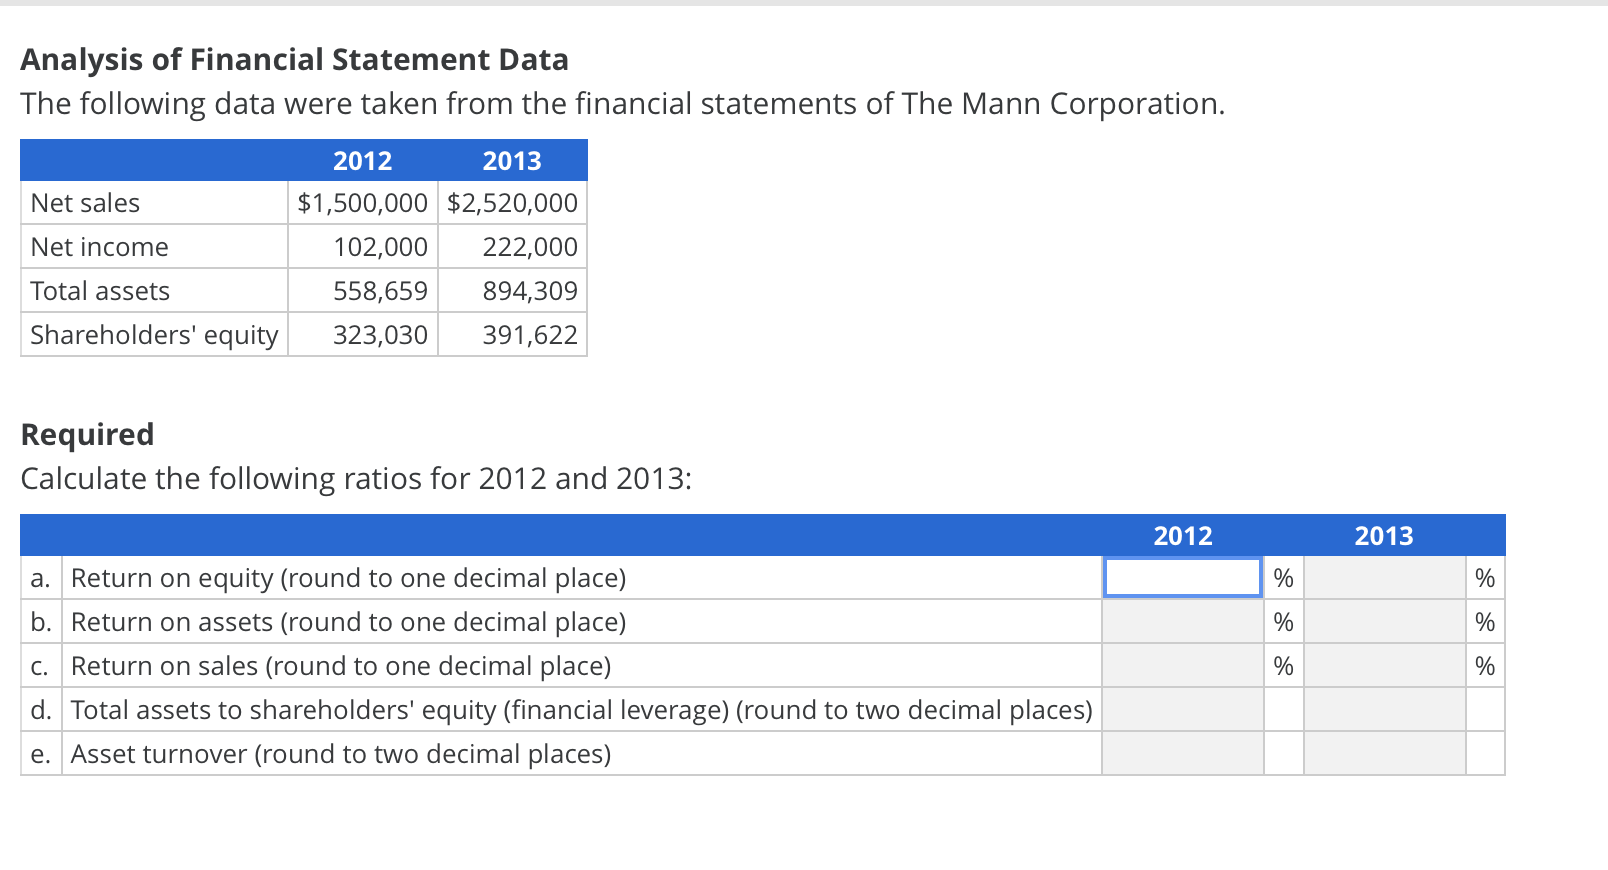
image text in transcribed

Analysis of Financial Statement Data The following data were taken from the financial statements of The Mann Corporation. 2012 2013 Net sales Net income $1,500,000 $2,520,000 102,000 222,000 558,659 894,309 323,030 391,622 Total assets Shareholders' equity Required Calculate the following ratios for 2012 and 2013: 2012 2013 % % % % a. Return on equity (round to one decimal place) b. Return on assets (round to one decimal place) C. Return on sales (round to one decimal place) d. Total assets to shareholders' equity (financial leverage) (round to two decimal places) e. Asset turnover (round to two decimal places) % %

Step by Step Solution

There are 3 Steps involved in it

Step: 1

blur-text-image

Get Instant Access to Expert-Tailored Solutions

See step-by-step solutions with expert insights and AI powered tools for academic success

Step: 2

blur-text-image_2

Step: 3

blur-text-image_3

Ace Your Homework with AI

Get the answers you need in no time with our AI-driven, step-by-step assistance

Get Started

Recommended Textbook for

Learning Sage 50 Accounting A Modular Approach

Authors: Harvey Freedman, Carol Smith Smith

16th Edition

0176741437, 978-0176741433

More Books

Students also viewed these Accounting questions

Question

What is a research memo designed to do?

Answered: 1 week ago