Question
Analysts at a company that produces small appliances are looking at sales of their blender in a medium-sized city in the Midwest. They have noticed
Analysts at a company that produces small appliances are looking at sales of their blender in a medium-sized city in the Midwest. They have noticed that sales in this city have not been meeting forecast values for several months and want to look at the problem in more detail. They have collected data on monthly sales ($), advertising expenditure ($), the number of competing products available, and the warranty period of the item from 9 retail outlets they sell the blender to. Their intent was to develop a multiple regression model that will predict the average monthly sales of the blender using the 3 independent variables noted. The data for this study and partial Excel output is provided below. Use this information to answer the questions that follow.
observations sales advertising number of competitors warranty(years)
1 4565 459 1 2
2 4896 545 0 0.25
3 4480 472 2 1.00
4 4300 482 3 2.00
5 3502 435 3 0.25
6 4413 499 3 1.00
7 5868 604 0 1.00
8 4527 501 1 1.00
9 3849 370 3 1.00
SUMMARY OUTPUT Regression Statistics
Multiple R
R Square
Adjusted R
Square Standard Error
Observations
ANOVA SS DF MS F
REGRESSION 3117368.0
RESIDUAL 76497.82
TOTAL 3499857.0
COEFFCIENTS STANDARD ERROR TSTAT
INTERCEPTS 1456.867 1219.6.77 1.194469
ADVERSTISING 6.432963 2.171256
COMPETITION -188.249 110.2911
WARRANTY 232.3621 158.6014
RESIDUAL OUTPUT
OBSERVATION PREDICTED Y RESIDUALS
1
2 5020.922 -124.922
3 4349.089 130.9114
4. 4457. 531 -157.531
5. 3748.548 -246.548
6 4334.529 78.47063
7 5574.738 293.2617
8 4723.894 -196.894
9 3504.677 344.3228
1. What is the least squares regression model that will predict monthly sales of the blender from advertising expenditure, the number of competing products available, and warranty period of the item?
2. Interpret the meaning of each slope and the y intercept of the model. Do you think that the y intercept makes sense for these data?
3. Construct a 95% confidence interval estimate of the true population slope for the advertising variable. Interpret the practical meaning of the resulting interval, in plain English.
4. Construct an appropriate interval estimate of the monthly sales of the blender for a store that spends $500 on advertising, has 2 competitors, and offers an 18-month (1.5 years) warranty on the item, with 98% confidence. Interpret the practical meaning of this interval estimate, in plain English.
5. At the 0.05 level of significance, is the overall regression model statistically significant? Do a complete and appropriate hypothesis test.
6. Is the variable “number of competitors” useful in the prediction of monthly sales? Do a complete and appropriate hypothesis test used? = .05.
7. After taking into account the sample size and number of independent variables in the model, what percent of the total variability in monthly sales can be explained by this regression model?
8. Manually calculate the residual for the first observation in the data set.

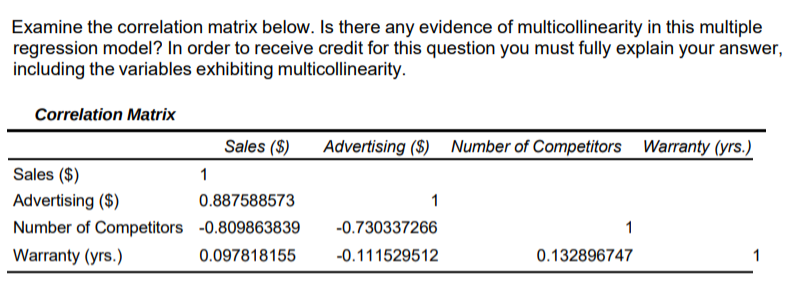
Examine the correlation matrix below. Is there any evidence of multicollinearity in this multiple regression model? In order to receive credit for this question you must fully explain your answer, including the variables exhibiting multicollinearity. Correlation Matrix Sales ($) Advertising ($) Number of Competitors Warranty (yrs.) 1 Sales ($) 0.887588573 -0.809863839 0.097818155 Advertising ($) Number of Competitors Warranty (yrs.) 1 -0.730337266 -0.111529512 1 0.132896747 1
Step by Step Solution
3.49 Rating (169 Votes )
There are 3 Steps involved in it
Step: 1
Solution Here are the answers to the questions 1 The least squares regression model that will predict monthly sales of the blender from advertising ex...
Get Instant Access to Expert-Tailored Solutions
See step-by-step solutions with expert insights and AI powered tools for academic success
Step: 2

Step: 3

Ace Your Homework with AI
Get the answers you need in no time with our AI-driven, step-by-step assistance
Get Started


