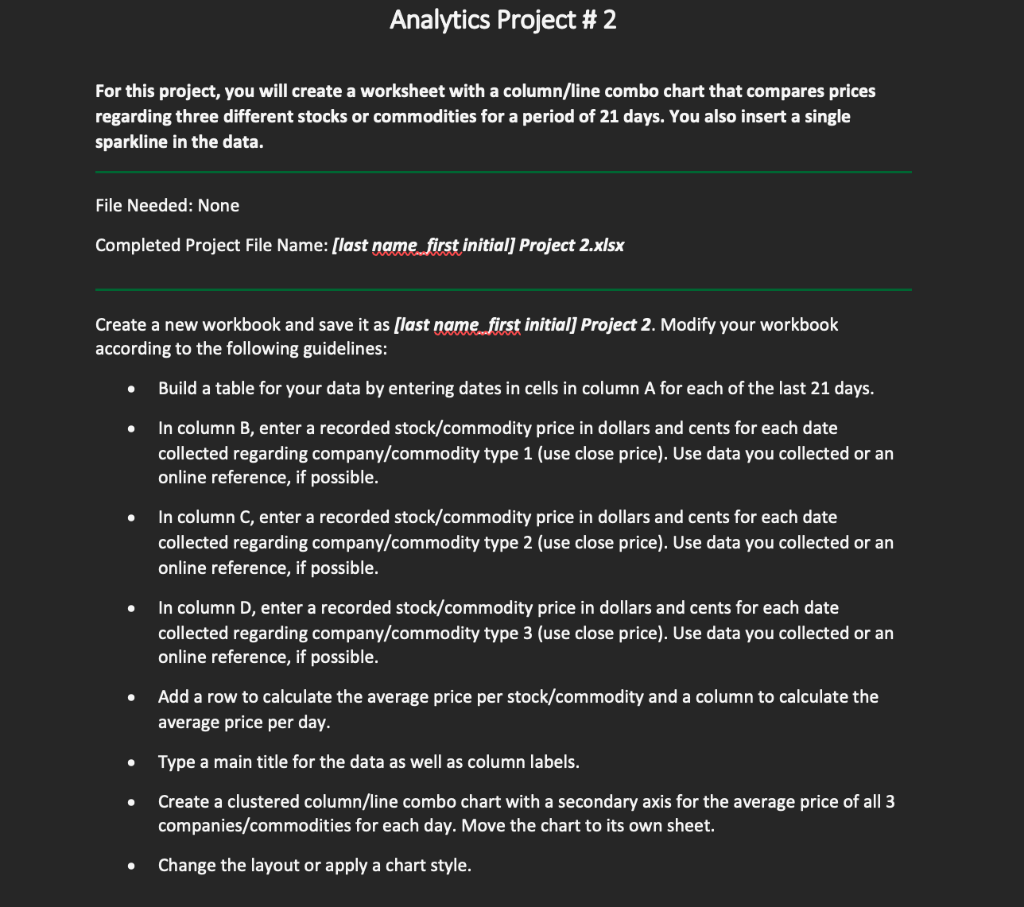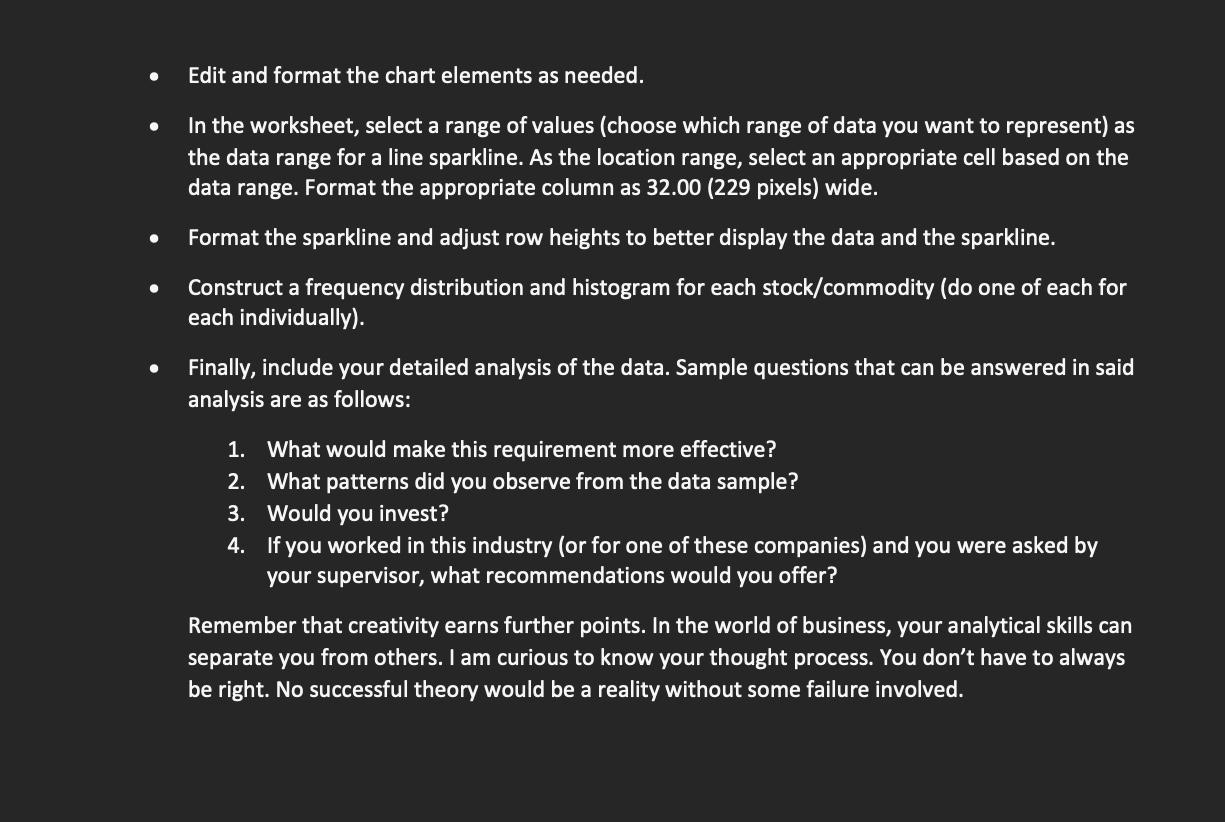

Analytics Project # 2 For this project, you will create a worksheet with a column/line combo chart that compares prices regarding three different stocks or commodities for a period of 21 days. You also insert a single sparkline in the data. File Needed: None Completed Project File Name: [last name first initial] Project 2.x/sx Create a new workbook and save it as [Ilast nqme. first initial] Project 2. Modify your workbook according to the following guidelines: - Build a table for your data by entering dates in cells in column A for each of the last 21 days. - In column B, enter a recorded stock/commodity price in dollars and cents for each date collected regarding company/commodity type 1 (use close price). Use data you collected or an online reference, if possible. - In column C, enter a recorded stock/commodity price in dollars and cents for each date collected regarding company/commodity type 2 (use close price). Use data you collected or an online reference, if possible. - In column D, enter a recorded stock/commodity price in dollars and cents for each date collected regarding company/commodity type 3 (use close price). Use data you collected or an online reference, if possible. - Add a row to calculate the average price per stock/commodity and a column to calculate the average price per day. - Type a main title for the data as well as column labels. - Create a clustered column/line combo chart with a secondary axis for the average price of all 3 companies/commodities for each day. Move the chart to its own sheet. - Change the layout or apply a chart style. - Edit and format the chart elements as needed. - In the worksheet, select a range of values (choose which range of data you want to represent) as the data range for a line sparkline. As the location range, select an appropriate cell based on the data range. Format the appropriate column as 32.00 ( 229 pixels) wide. - Format the sparkline and adjust row heights to better display the data and the sparkline. - Construct a frequency distribution and histogram for each stock/commodity (do one of each for each individually). - Finally, include your detailed analysis of the data. Sample questions that can be answered in said analysis are as follows: 1. What would make this requirement more effective? 2. What patterns did you observe from the data sample? 3. Would you invest? 4. If you worked in this industry (or for one of these companies) and you were asked by your supervisor, what recommendations would you offer? Remember that creativity earns further points. In the world of business, your analytical skills can separate you from others. I am curious to know your thought process. You don't have to always be right. No successful theory would be a reality without some failure involved. Analytics Project # 2 For this project, you will create a worksheet with a column/line combo chart that compares prices regarding three different stocks or commodities for a period of 21 days. You also insert a single sparkline in the data. File Needed: None Completed Project File Name: [last name first initial] Project 2.x/sx Create a new workbook and save it as [Ilast nqme. first initial] Project 2. Modify your workbook according to the following guidelines: - Build a table for your data by entering dates in cells in column A for each of the last 21 days. - In column B, enter a recorded stock/commodity price in dollars and cents for each date collected regarding company/commodity type 1 (use close price). Use data you collected or an online reference, if possible. - In column C, enter a recorded stock/commodity price in dollars and cents for each date collected regarding company/commodity type 2 (use close price). Use data you collected or an online reference, if possible. - In column D, enter a recorded stock/commodity price in dollars and cents for each date collected regarding company/commodity type 3 (use close price). Use data you collected or an online reference, if possible. - Add a row to calculate the average price per stock/commodity and a column to calculate the average price per day. - Type a main title for the data as well as column labels. - Create a clustered column/line combo chart with a secondary axis for the average price of all 3 companies/commodities for each day. Move the chart to its own sheet. - Change the layout or apply a chart style. - Edit and format the chart elements as needed. - In the worksheet, select a range of values (choose which range of data you want to represent) as the data range for a line sparkline. As the location range, select an appropriate cell based on the data range. Format the appropriate column as 32.00 ( 229 pixels) wide. - Format the sparkline and adjust row heights to better display the data and the sparkline. - Construct a frequency distribution and histogram for each stock/commodity (do one of each for each individually). - Finally, include your detailed analysis of the data. Sample questions that can be answered in said analysis are as follows: 1. What would make this requirement more effective? 2. What patterns did you observe from the data sample? 3. Would you invest? 4. If you worked in this industry (or for one of these companies) and you were asked by your supervisor, what recommendations would you offer? Remember that creativity earns further points. In the world of business, your analytical skills can separate you from others. I am curious to know your thought process. You don't have to always be right. No successful theory would be a reality without some failure involved


