Question
Analyze the 2018 Annual Report of AAON Company and provide the following: 1. Explain and provide the rationale of the case applicable financial ratios and
Analyze the 2018 Annual Report of AAON Company and provide the following: 1. Explain and provide the rationale of the case applicable financial ratios and display the financial ratio calculations and present the workings in your main body of the paper. (33 marks) 2. Assess the financial position of the company and determine your decision whether it would be worth investing your money into its stocks. Elaborate on the decision chosen and its rationale. (33 marks) 3. Evaluate the decision aspect of the financial ratios and comment about the overall management performance in last three years. (34 marks)

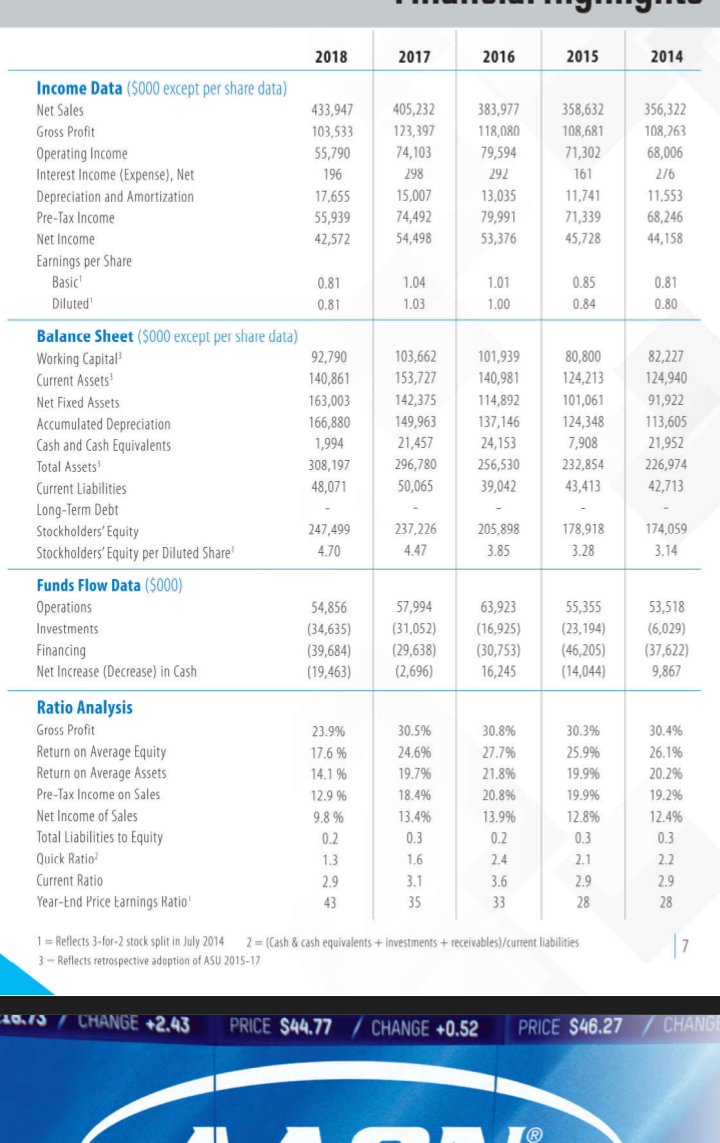
\begin{tabular}{|c|c|c|c|c|c|} \hline & 2018 & 2017 & 2016 & 2015 & 2014 \\ \hline \multicolumn{6}{|c|}{ Income Data (\$000 except per share data) } \\ \hline Net Sales & 433,947 & 405,232 & 383,977 & 358,632 & 356,322 \\ \hline Gross Profit & 103,533 & 123,397 & 118,080 & 108,681 & 108,263 \\ \hline Operating Income & 55,790 & 74,103 & 79,594 & 71,302 & 68,006 \\ \hline Interest Income (Expense), Net & 196 & 298 & 292 & 161 & 2/6 \\ \hline Depreciation and Amortization & 17,655 & 15,007 & 13,035 & 11,741 & 11,553 \\ \hline Pre-Tax Income & 55,939 & 74,492 & 79,991 & 71,339 & 68,246 \\ \hline Net Income & 42,572 & 54,498 & 53,376 & 45,728 & 44,158 \\ \hline \multicolumn{6}{|l|}{ Earnings per Share } \\ \hline Basic 1 & 0.81 & 1.04 & 1.01 & 0.85 & 0.81 \\ \hline Diluted' & 0.81 & 1.03 & 1.00 & 0.84 & 0.80 \\ \hline \multicolumn{6}{|c|}{ Balance Sheet ( $000 except per share data) } \\ \hline Working Capital 3 & 92,790 & 103,662 & 101,939 & 80,800 & 82,227 \\ \hline Current Assets 3 & 140,861 & 153,727 & 140,981 & 124,213 & 124,940 \\ \hline Net Fixed Assets & 163,003 & 142,375 & 114,892 & 101,061 & 91,922 \\ \hline Accumulated Depreciation & 166,880 & 149,963 & 137,146 & 124,348 & 113,605 \\ \hline Cash and Cash Equivalents & 1,994 & 21,457 & 24,153 & 7,908 & 21,952 \\ \hline Total Assets 3 & 308,197 & 296,780 & 256,530 & 232,854 & 226,974 \\ \hline Current Liabilities & 48,071 & 50,065 & 39,042 & 43,413 & 42,713 \\ \hline Long-Term Debt & - & - & - & - & - \\ \hline Stockholders' Equity & 247,499 & 237,226 & 205,898 & 178,918 & 174,059 \\ \hline Stockholders'Equity per Diluted Share' & 4.70 & 4.47 & 3.85 & 3.28 & 3.14 \\ \hline \multicolumn{6}{|l|}{ Funds Flow Data ($000)} \\ \hline Operations & 54,856 & 57,994 & \multirow{2}{*}{\begin{tabular}{c} 63,923 \\ (16,925) \end{tabular}} & 55,355 & 53,518 \\ \hline Investments & (34,635) & (31,052) & & (23,194) & (6,029) \\ \hline Financing & (39,684) & (29,638) & (30,753) & (46,205) & (37,622) \\ \hline Net Increase (Decrease) in Cash & (19,463) & (2,696) & 16,245 & (14,044) & 9,867 \\ \hline Ratio Analysis & & & & & \\ \hline Gross Profit & 23.9% & 30.5% & 30.8% & 30.3% & 30.4% \\ \hline Return on Average Equity & 17.6% & 24.6% & 27.7% & 25.9% & 26.1% \\ \hline Return on Average Assets & 14.1% & 19.7% & 21.8% & 19.9% & 20.2% \\ \hline Pre-Tax Income on Sales & 12.9% & 18.4% & 20.8% & 19.9% & 19.2% \\ \hline Net Income of Sales & 9.8% & 13.4% & 13.9% & 12.8% & 12.4% \\ \hline Total Liabilities to Equity & 0.2 & 0.3 & 0.2 & 0.3 & 0.3 \\ \hline Quick Ratio 2 & 1.3 & 1.6 & 2.4 & 2.1 & 2.2 \\ \hline Current Ratio & 2.9 & 3.1 & 3.6 & 2.9 & 2.9 \\ \hline Year-tnd Price tarnings Ratio' & 43 & 35 & 33 & 28 & 28 \\ \hline \begin{tabular}{l} 1= Reflects 3 -for-2 stock split in July 2014 \\ 3 - Reflects retrospective adoption of ASU 20 \end{tabular} & cash equivalen & ivestments & ables)/cur & & 17 \\ \hline S / CHA & 4.77 & HANGE + & & $46.2 & 0 \\ \hline \end{tabular}
Step by Step Solution
There are 3 Steps involved in it
Step: 1

Get Instant Access to Expert-Tailored Solutions
See step-by-step solutions with expert insights and AI powered tools for academic success
Step: 2

Step: 3

Ace Your Homework with AI
Get the answers you need in no time with our AI-driven, step-by-step assistance
Get Started


