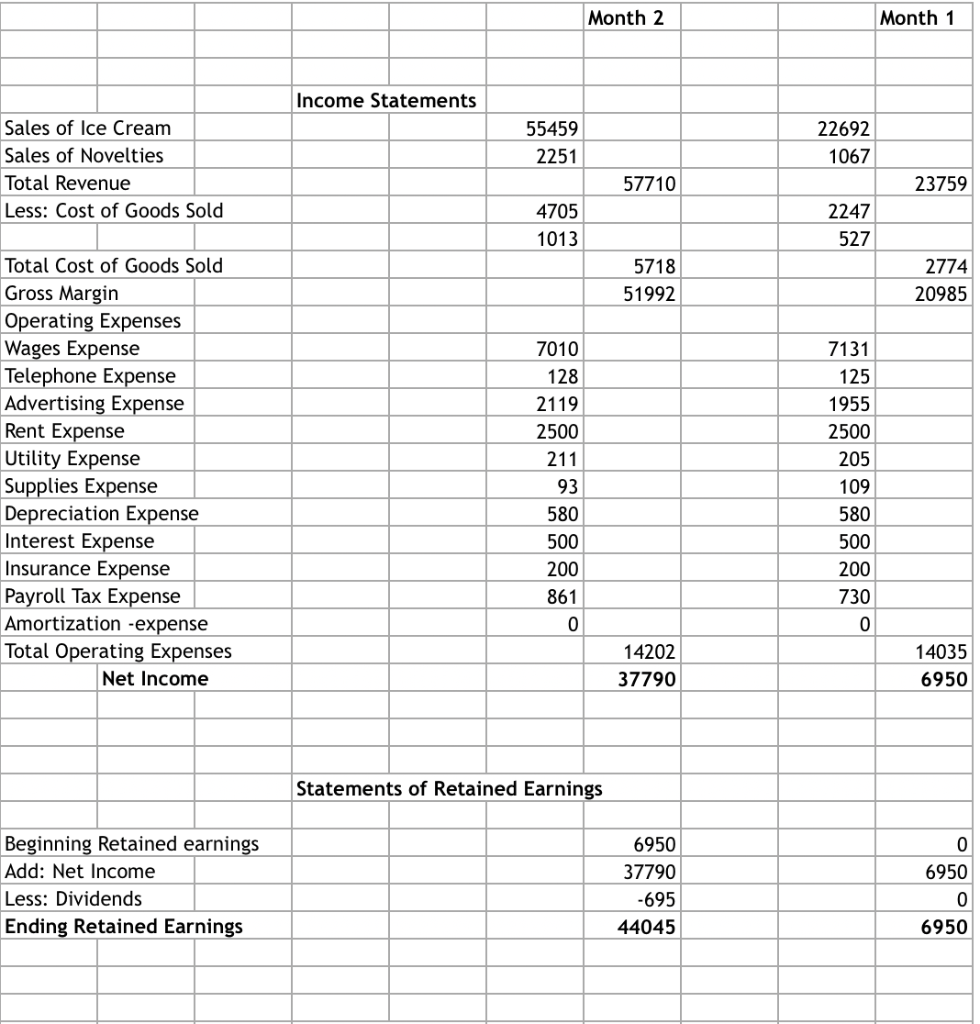
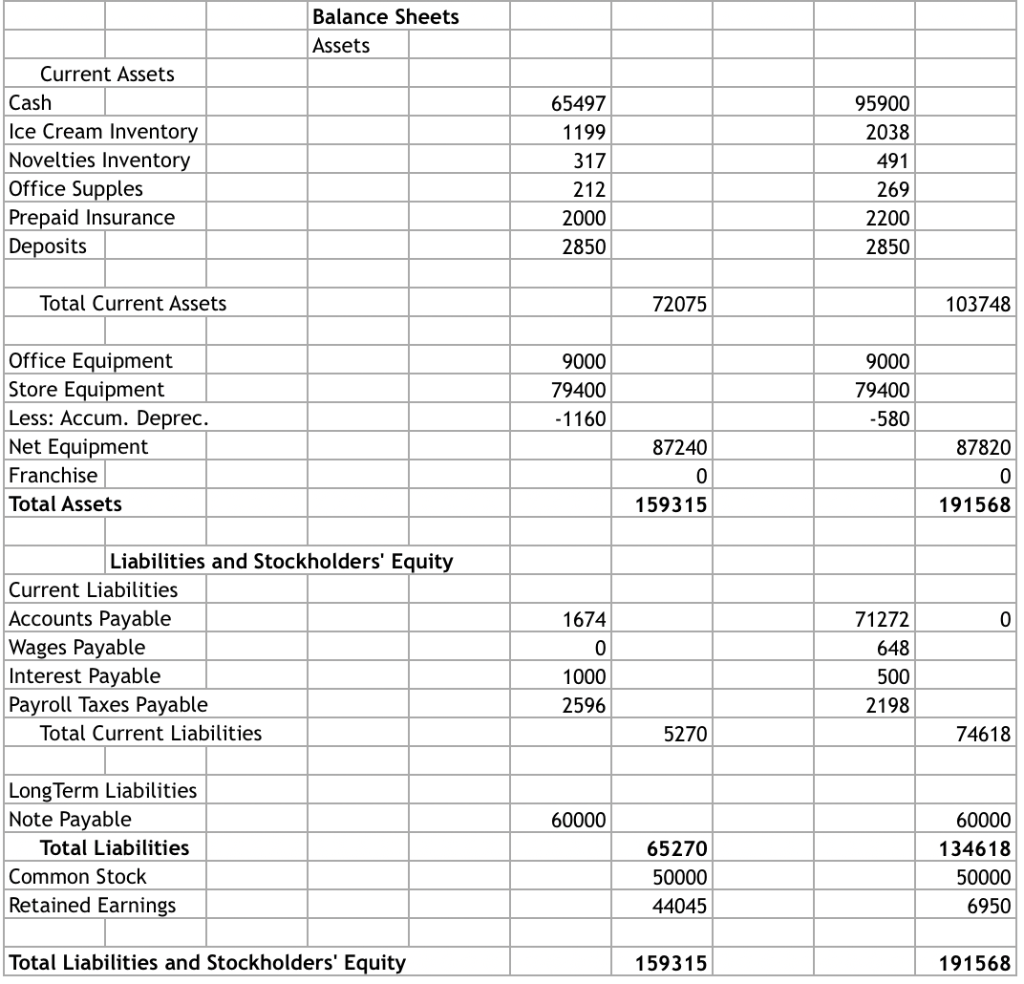
Analyze the financial statements of two other companies. Give a recommendation on which of the companies should invest given the financial results for the month. You should analyze the financial performance of each company. At a minimum, you should calculate the following ratios as we have discussed in class for each company: Return on Assets Return on Equity Debt Ratio Gross profit percentage Days sales in inventory Current Ratio Given the ratios and financial statements, you should give a recommendation on which company I should invest. You should then support why you have made this recommendation (this is a very crucial step of this project so make sure you do it). Also, discuss what this company did right/differently that the other companies did not do.
TEAM TOM
TEAM OSCAR
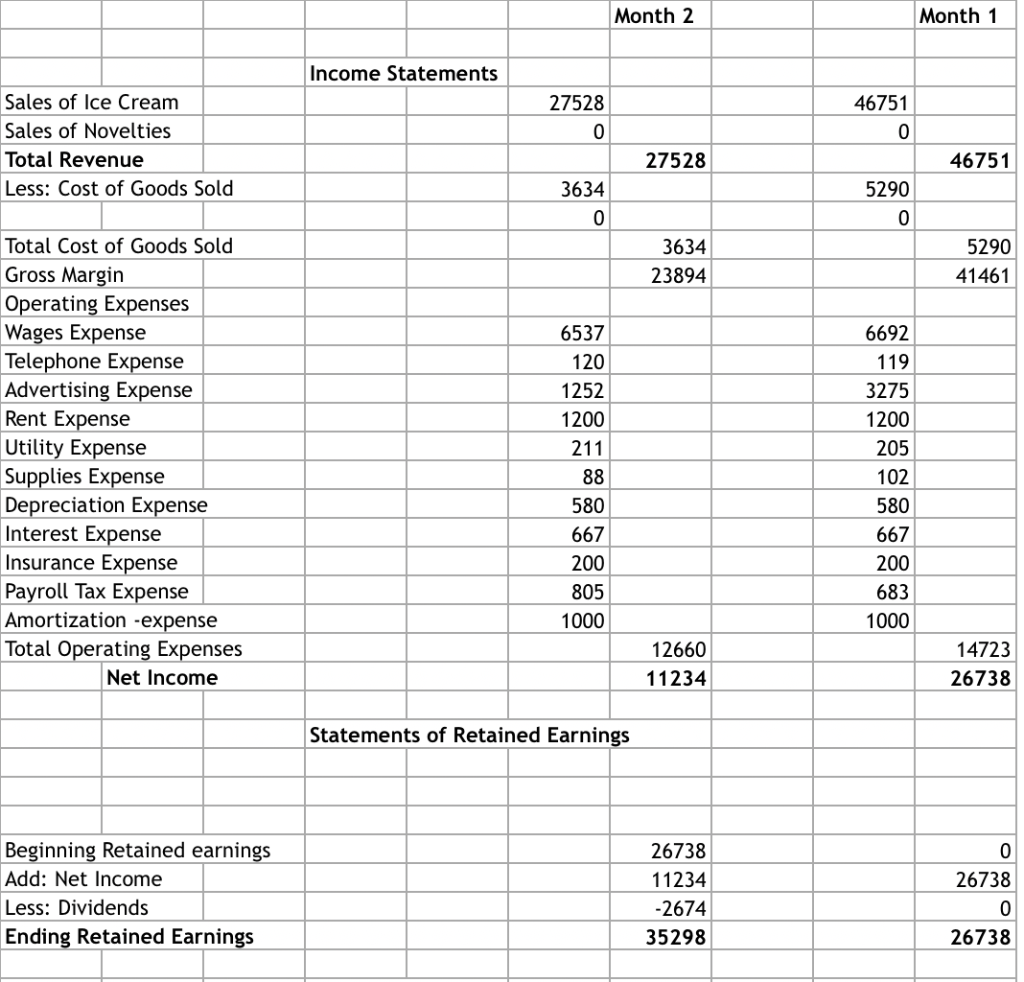
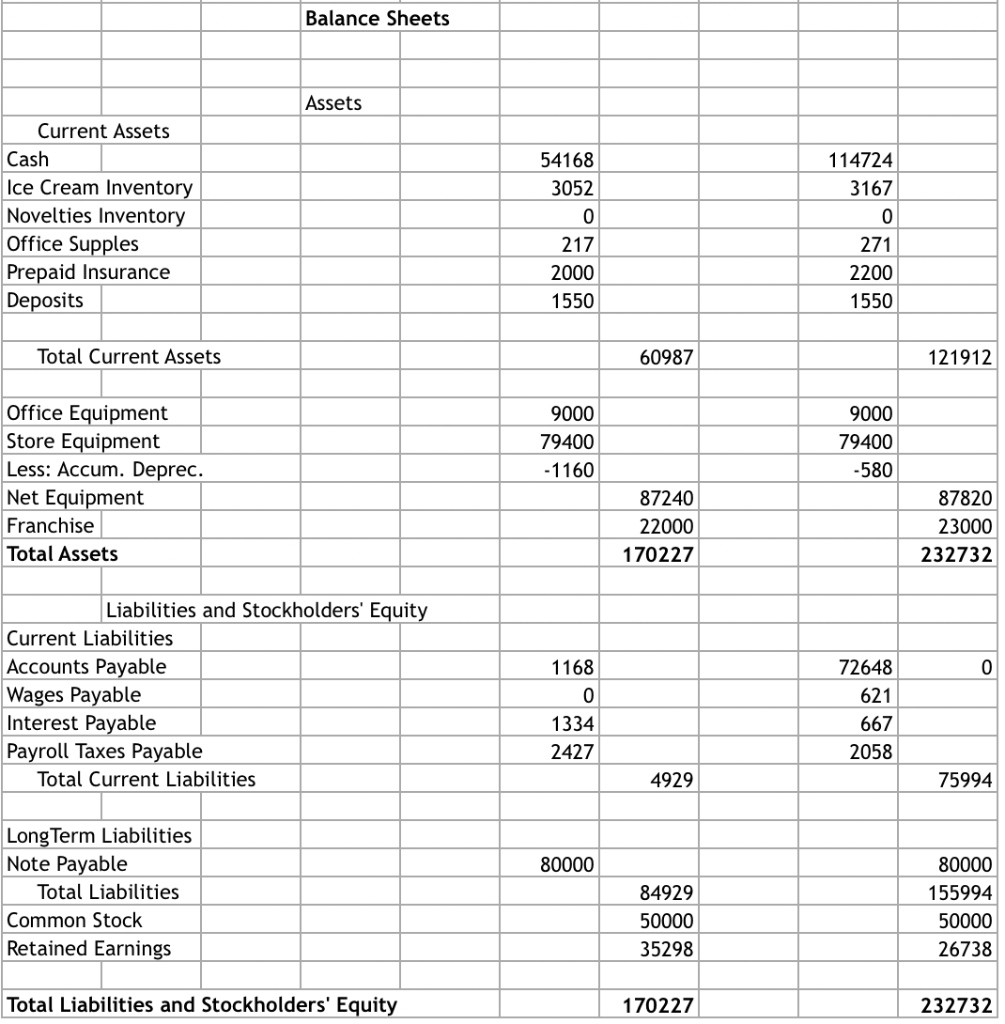
Month 2 Month 1 Income Statements 55459 2251 22692 1067 Sales of Ice Cream Sales of Novelties Total Revenue Less: Cost of Goods Sold 57710 23759 4705 1013 2247 527 5718 51992 2774 20985 Total Cost of Goods Sold Gross Margin Operating Expenses Wages Expense Telephone Expense Advertising Expense Rent Expense Utility Expense Supplies Expense Depreciation Expense Interest Expense Insurance Expense Payroll Tax Expense Amortization -expense Total Operating Expenses Net Income 7010 128 2119 2500 211 93 580 500 200 861 0 7131 125 1955 2500 205 109 580 500 200 730 0 14202 37790 14035 6950 Statements of Retained Earnings 6950 Beginning Retained earnings Add: Net Income Less: Dividends Ending Retained Earnings 6950 37790 -695 44045 6950 Balance Sheets Assets Current Assets Cash Ice Cream Inventory Novelties Inventory Office Supples Prepaid Insurance Deposits 65497 1199 317 212 2000 2850 95900 2038 491 269 2200 2850 Total Current Assets 72075 103748 9000 79400 - 1160 9000 79400 -580 Office Equipment Store Equipment Less: Accum. Deprec. Net Equipment Franchise Total Assets 87240 87820 159315 191568 Liabilities and Stockholders' Equity Current Liabilities Accounts Payable Wages Payable Interest Payable Payroll Taxes Payable Total Current Liabilities 1674 0 1000 2596 71272 648 500 2198 5270 74618 60000 Long Term Liabilities Note Payable Total Liabilities Common Stock Retained Earnings 65270 50000 44045 60000 134618 50000 6950 Total Liabilities and Stockholders' Equity 159315 191568 Month 2 Month 1 Income Statements 27528 46751 0 Sales of Ice Cream Sales of Novelties Total Revenue Less: Cost of Goods Sold 27528 46751 5290 3634 0 3634 23894 5290 41461 Total Cost of Goods Sold Gross Margin Operating Expenses Wages Expense Telephone Expense Advertising Expense Rent Expense Utility Expense Supplies Expense Depreciation Expense Interest Expense Insurance Expense Payroll Tax Expense Amortization - expense Total Operating Expenses Net Income 6537 120 1252 1200 211 88 6692 119 3275 1200 205 102 580 667 200 683 1000 580 667 200 805 1000 12660 11234 14723 26738 Statements of Retained Earnings 26738 Beginning Retained earnings Add: Net Income Less: Dividends Ending Retained Earnings 26738 11234 -2674 35298 26738 Balance Sheets Assets Current Assets Cash Ice Cream Inventory Novelties Inventory Office Supples Prepaid Insurance Deposits 54168 3052 0 217 2000 1550 114724 3167 0 271 2200 1550 Total Current Assets 60987 121912 9000 79400 - 1160 9000 79400 -580 Office Equipment Store Equipment Less: Accum. Deprec. Net Equipment Franchise Total Assets 87240 22000 170227 87820 23000 232732 1168 Liabilities and Stockholders' Equity Current Liabilities Accounts Payable Wages Payable Interest Payable Payroll Taxes Payable Total Current Liabilities 72648 621 667 2058 1334 2427 4929 75994 80000 Long Term Liabilities Note Payable Total Liabilities Common Stock Retained Earnings 84929 50000 35298 80000 155994 50000 26738 Total Liabilities and Stockholders' Equity 170227 232732


