Answered step by step
Verified Expert Solution
Question
1 Approved Answer
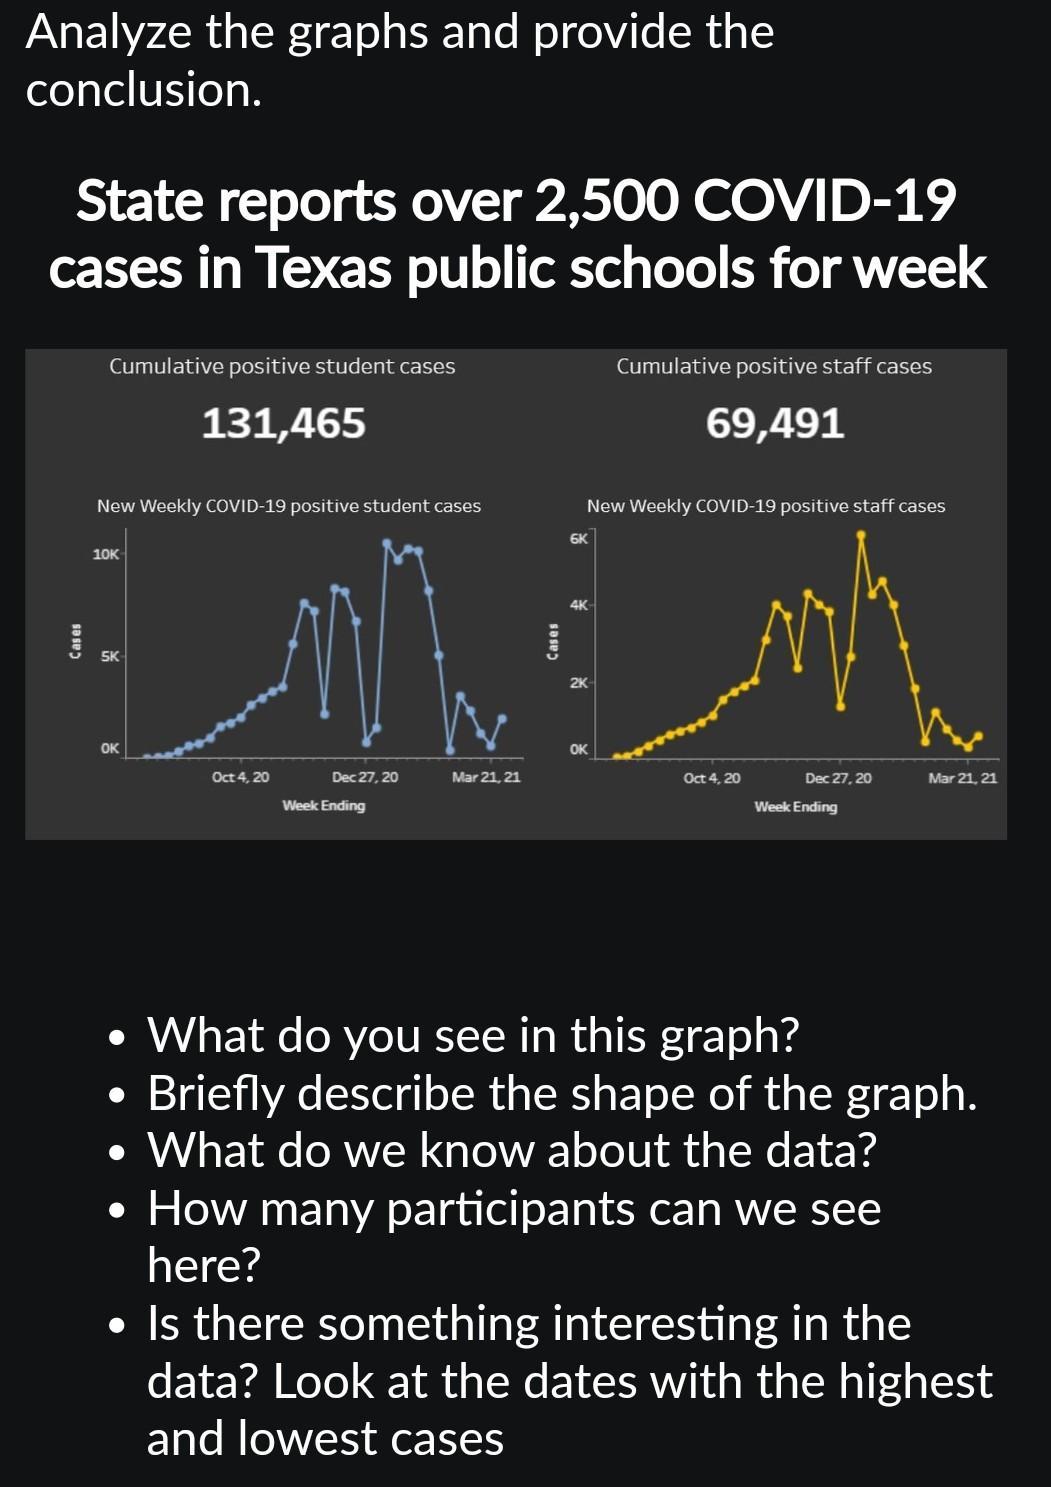
Analyze the graphs and provide the conclusion. State reports over 2,500 COVID-19 cases in Texas public schools for week Cases Cumulative positive student cases

Analyze the graphs and provide the conclusion. State reports over 2,500 COVID-19 cases in Texas public schools for week Cases Cumulative positive student cases 131,465 New Weekly COVID-19 positive student cases 10K 5K OK Oct 4, 20 Dec 27, 20 Week Ending Mar 21, 21 New Weekly COVID-19 positive staff cases 6K 4K Cumulative positive staff cases 69,491 2K Oct 4, 20 Dec 27, 20 Week Ending Mar 21, 21 What do you see in this graph? Briefly describe the shape of the graph. What do we know about the data? How many participants can we see here? Is there something interesting in the data? Look at the dates with the highest and lowest cases
Step by Step Solution
★★★★★
3.44 Rating (157 Votes )
There are 3 Steps involved in it
Step: 1
1 Here the case in the graph we can see new could 19 pasitive student every week second 2 gr...
Get Instant Access to Expert-Tailored Solutions
See step-by-step solutions with expert insights and AI powered tools for academic success
Step: 2

Step: 3

Ace Your Homework with AI
Get the answers you need in no time with our AI-driven, step-by-step assistance
Get Started


