

Answered step by step
Verified Expert Solution
Question
1 Approved Answer
Analyze the store count projection by Deutsche Bank. Do you agree with the forecast? Why or why not? Analyze the store count projection by Deutsche
Analyze the store count projection by Deutsche Bank. Do you agree with the forecast? Why or why not?
Analyze the store count projection by Deutsche Bank. Do you agree with the forecast? Why or why not?
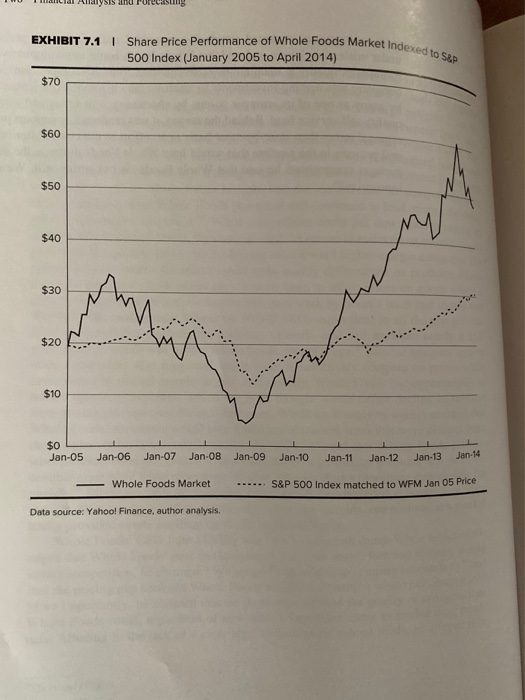
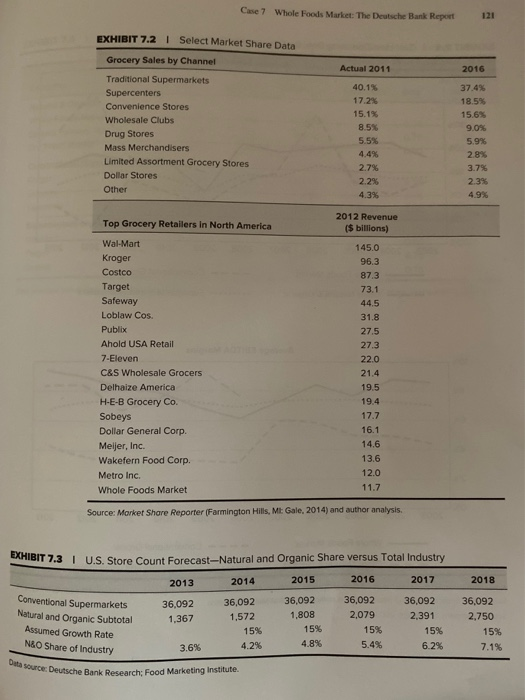
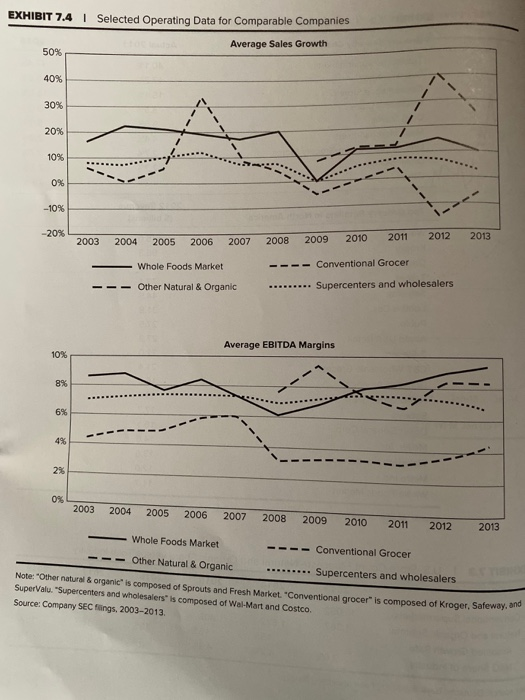
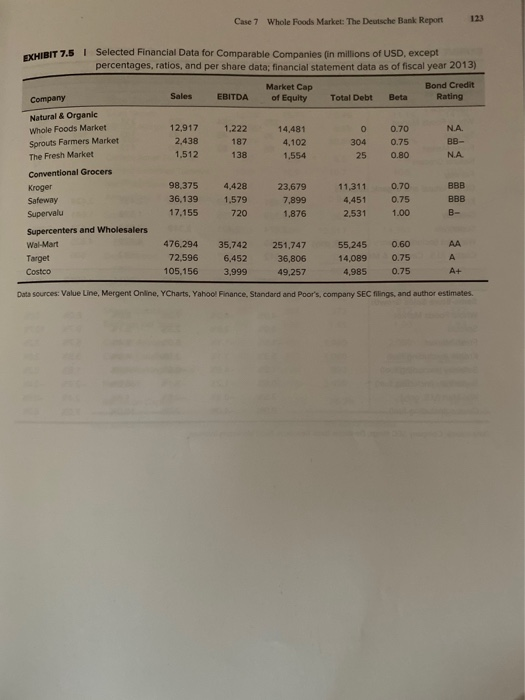
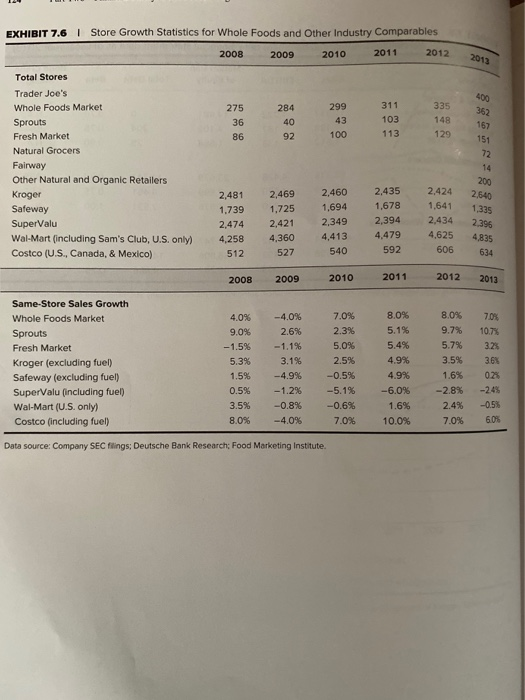
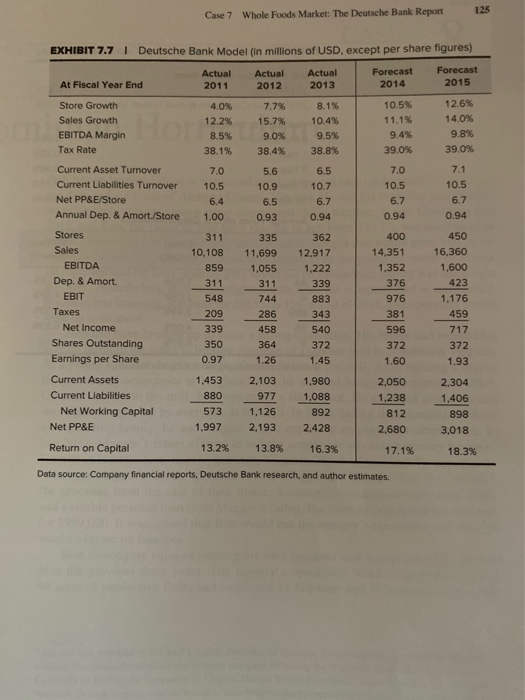
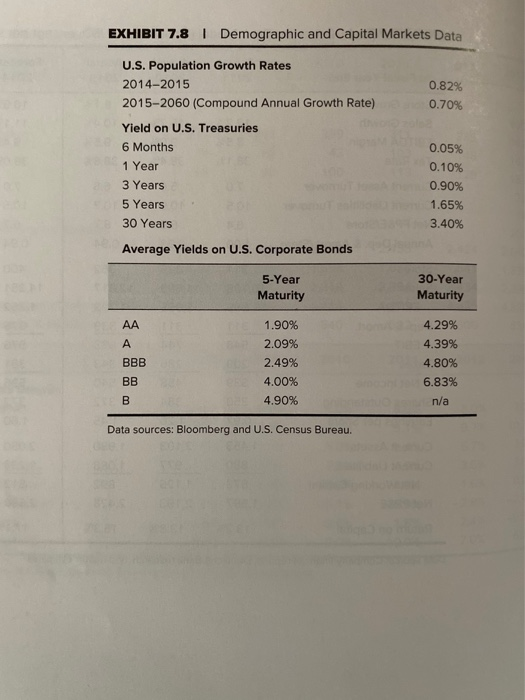
SISine EXHIBIT 7.1 I Share Price Performance of Whole Foods Market Indexed to S&P 500 Index (January 2005 to April 2014) $70 $60 $50 $40 $30 $20 $10 $0 Jan-05 Jan-06 Jan-07 Jan-08 Jan-09 Jan-10 Jan-11 Jan-12 Jan-13 Jan-14 Whole Foods Market S&P 500 Index matched to WFM Jan 05 Price Data source: Yahoo! Finance, author analysis. Data Source: Deutsche Bank Research Food Marketing Institute Case 7 Whole Foods Market: The Deutsche Bank Report 121 EXHIBIT 7.2 | Select Market Share Data Actual 2011 2016 37.4% Grocery Sales by Channel Traditional Supermarkets Supercenters Convenience Stores Wholesale Clubs Drug Stores Mass Merchandisers Limited Assortment Grocery Stores Dollar Stores Other 40.1% 17.2% 15.1% 8.5% 5.5% 18.5% 15.6% 9.0% 5.9% 2.8% 3.7% 2.3% 4.9% 2.7% 2.2% 4.3% Top Grocery Retailers in North America 2012 Revenue ($ billions) Wal-Mart Kroger Costco Target Safeway Loblaw Cos. Publix Ahold USA Retail 7-Eleven C&S Wholesale Grocers Delhaize America H-E-B Grocery Co. Sobeys Dollar General Corp. Meijer, Inc. Wakefern Food Corp. Metro Inc. Whole Foods Market 145.0 96.3 87.3 73.1 44.5 31.8 27.5 27.3 22.0 21.4 19.5 19.4 17.7 16.1 14.6 13.6 12.0 11.7 Source: Market Share Reporter (Farmington Hills, MI: Gale, 2014) and author analysis. EXHIBIT 7.3 | U.S. Store Count Forecast - Natural and Organic Share versus Total Industry 2013 2014 2015 2016 2017 2018 Conventional Supermarkets Natural and Organic Subtotal Assumed Growth Rate N&O Share of Industry 36,092 1.367 36,092 1,572 15% 4.2% 36,092 1,808 15% 4.8% 36,092 2,079 15% 5.4% 36,092 2,391 15% 6.2% 36,092 2.750 15% 7.1% 3.6% EXHIBIT 7.4 Selected Operating Data for Comparable Companies Average Sales Growth 50% 40% 30% 20% 10% 0% -10% -20% 2003 2011 2004 2012 2013 2005 2006 2008 2009 2007 2010 Whole Foods Market ---- Conventional Grocer Other Natural & Organic ........ Supercenters and wholesalers Average EBITDA Margins 10% 8% 6% 4% 2% 0% 2003 2004 2005 2006 2007 2008 2009 2010 2011 2012 2013 Whole Foods Market ---- Conventional Grocer Other Natural & Organic ... Supercenters and wholesalers Note: "Other natural & organic" is composed of Sprouts and Fresh Market "Conventional grocer" is composed of Kroger, Safeway, and SuperValu. "Supercenters and wholesalers" is composed of Wal-Mart and Costco. Source: Company SEC fings, 2003-2013 Case 7 Whole Foods Market: The Deutsche Bank Report 121 Company Sprouts Farmers Market EXHIBIT 7.5 Selected Financial Data for comparable Companies (in Millions of USD, except percentages, ratios, and per share data; financial statement data as of fiscal year 2013) Market Cap Bond Credit Sales EBITDA of Equity Total Debt Beta Rating Natural & Organic Whole Foods Market 12,917 1.222 14,481 0 0.70 NA 2,438 187 4,102 304 0.75 BB- The Fresh Market 1,512 138 1,554 25 0.80 NA Conventional Grocers Kroger 98,375 4,428 23,679 11,311 0.70 BBB Safeway 36,139 1.579 7,899 4,451 0.75 BBB Supervalu 17.155 720 1.876 2.531 1.00 B- Supercenters and Wholesalers Wal-Mart 476,294 35,742 251,747 55,245 0.60 AA Target 72.596 6,452 36,806 14,089 0.75 A Costco 105,156 3,999 49,257 4,985 0.75 A+ Data sources: Value Line, Mergent Online, Charts, Yahool Finance, Standard and Poor's, company SEC filings, and author estimates. EXHIBIT 7.6 Store Growth Statistics for Whole Foods and Other Industry Comparables 2008 2009 2010 2011 2012 2012 275 36 86 284 40 299 43 100 311 103 113 335 148 129 92 Total Stores Trader Joe's Whole Foods Market Sprouts Fresh Market Natural Grocers Fairway Other Natural and Organic Retailers Kroger Safeway SuperValu Wal-Mart (including Sam's Club, U.S. only) Costco (U.S., Canada, & Mexico) 352 167 151 72 14 200 2.640 1,335 2,396 4,835 634 2,481 1.739 2,474 4,258 512 2,469 1,725 2,421 4,360 527 2,460 1,694 2,349 4,413 540 2,435 1,678 2,394 4,479 592 2.424 1.641 2,434 4,625 606 2008 2009 2010 2011 2012 2013 Same-Store Sales Growth Whole Foods Market Sprouts Fresh Market Kroger (excluding fuel) Safeway (excluding fuel) SuperValu (including fuel) Wal-Mart (U.S. only) Costco (including fuel) 4.0% 9.0% -1.5% 5.3% 1.5% 0.5% 3.5% 8.0% -4.0% 2.6% -1.1% 3.1% -4.9% -1.2% -0.8% -4.0% 7.0% 2.3% 5.0% 2.5% -0.5% -5.1% -0.6% 7.0% 8.0% 5.1% 5.4% 4.9% 4.9% -6.0% 1.6% 10.0% 8.0% 9.7% 5.7% 3.5% 1.6% -2.8% 2.4% 7.0% 7.0% 10.7% 32% 3.6% 0.2% -0.5% 60% Data source: Company SEC filings; Deutsche Bank Research Food Marketing Institute 125 Case 7 Whole Foods Market: The Deutsche Bank Report EXHIBIT 7.7 | Deutsche Bank Model (in millions of USD, except per share figures) Actual 2011 Actual 2012 At Fiscal Year End Actual 2013 Forecast 2014 Forecast 2015 Store Growth Sales Growth EBITDA Margin Tax Rate 4.0% 12.2% 8.5% 38.1% 7.7% 15.7% 9.0% 38.4% 8.1% 10.4% 9.5% 38.8% 10.5% 11.1% 9.4% 39.0% 12.6% 14.0% 9.8% 39.0% 7.0 10.5 6.4 5.6 10.9 6.5 0.93 6.5 10.7 6.7 0.94 7.0 10.5 6.7 0.94 7.1 10.5 6.7 0.94 1.00 Current Asset Turnover Current Liabilities Turnover Net PP&E/Store Annual Dep. & Amort./Store Stores Sales EBITDA Dep. & Amort. EBIT Taxes Net Income Shares Outstanding Earnings per Share Current Assets Current Liabilities Net Working Capital Net PP&E 311 10.108 859 311 548 209 339 350 0.97 335 11,699 1,055 311 744 286 458 364 1.26 362 12.917 1.222 339 883 343 540 372 1.45 400 14,351 1.352 376 976 381 596 372 1.60 450 16,360 1,600 423 1,176 459 717 372 1.93 1,453 880 573 1.997 2,103 977 1,126 2,193 1.980 1.088 892 2,428 2,050 1.238 812 2,680 2,304 1,406 898 3,018 Return on Capital 13.2% 13.8% 16.3% 17.1% 18.3% Data source: Company financial reports, Deutsche Bank research, and author estimates. EXHIBIT 7.8 | Demographic and Capital Markets Data 0.82% 0.70% U.S. Population Growth Rates 2014-2015 2015-2060 (Compound Annual Growth Rate) Yield on U.S. Treasuries 6 Months 1 Year 3 Years 5 Years 30 Years 0.05% 0.10% 0.90% 1.65% 3,40% Average Yields on U.S. Corporate Bonds 5-Year Maturity 30-Year Maturity AA A BBB 1.90% 2.09% 2.49% 4.00% 4.90% 4.29% 4.39% 4.80% 6.83% n/a BB B Data sources: Bloomberg and U.S. Census BureauStep by Step Solution
There are 3 Steps involved in it
Step: 1

Get Instant Access to Expert-Tailored Solutions
See step-by-step solutions with expert insights and AI powered tools for academic success
Step: 2

Step: 3
Ace Your Homework with AI
Get the answers you need in no time with our AI-driven, step-by-step assistance
Get Started
International Business Competing In The Global Marketplace
Authors: Charles Hill
14th Edition
1260387542, 9781260387544