Question
Analyzing a mixed cost using regression data Jackson Co. documented their production levels and overhead costs for the past six months. Month January February

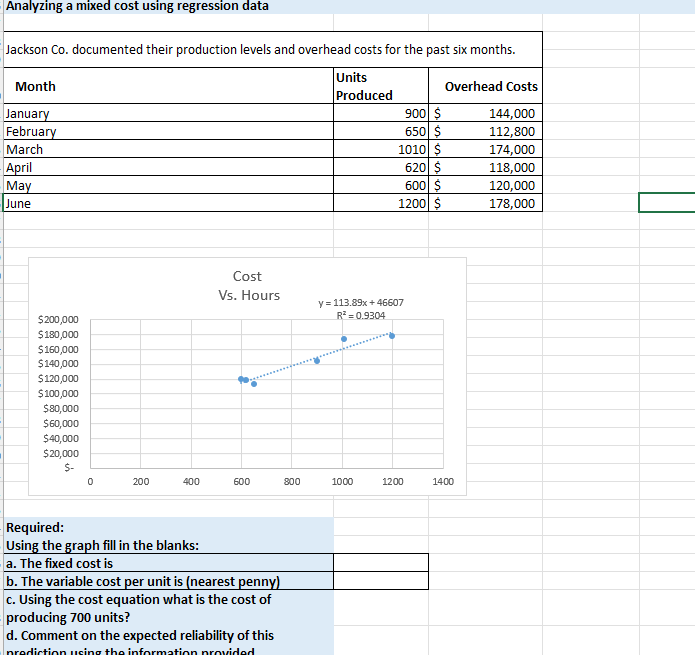
Analyzing a mixed cost using regression data Jackson Co. documented their production levels and overhead costs for the past six months. Month January February March April May June $200,000 $180,000 $160,000 Units Produced Overhead Costs 900 $ 144,000 650 $ 112,800 1010 $ 174,000 620 $ 118,000 600 $ 120,000 1200 $ 178,000 Cost Vs. Hours y=113.89x+46607 R=0.9304 $140,000 $120,000 $100,000 $80,000 $60,000 $40,000 $20,000 $- 0 200 400 600 800 1000 1200 1400 Required: Using the graph fill in the blanks: a. The fixed cost is b. The variable cost per unit is (nearest penny) c. Using the cost equation what is the cost of producing 700 units? d. Comment on the expected reliability of this prediction using the information provided
Step by Step Solution
There are 3 Steps involved in it
Step: 1

Get Instant Access to Expert-Tailored Solutions
See step-by-step solutions with expert insights and AI powered tools for academic success
Step: 2

Step: 3

Ace Your Homework with AI
Get the answers you need in no time with our AI-driven, step-by-step assistance
Get StartedRecommended Textbook for
Managerial Accounting A Focus on Ethical Decision Making
Authors: Steve Jackson, Roby Sawyers, Greg Jenkins
5th edition
324663854, 978-0324663853
Students also viewed these Accounting questions
Question
Answered: 1 week ago
Question
Answered: 1 week ago
Question
Answered: 1 week ago
Question
Answered: 1 week ago
Question
Answered: 1 week ago
Question
Answered: 1 week ago
Question
Answered: 1 week ago
Question
Answered: 1 week ago
Question
Answered: 1 week ago
Question
Answered: 1 week ago
Question
Answered: 1 week ago
Question
Answered: 1 week ago
Question
Answered: 1 week ago
Question
Answered: 1 week ago
Question
Answered: 1 week ago
Question
Answered: 1 week ago
Question
Answered: 1 week ago
Question
Answered: 1 week ago
Question
Answered: 1 week ago
Question
Answered: 1 week ago
Question
Answered: 1 week ago
View Answer in SolutionInn App


