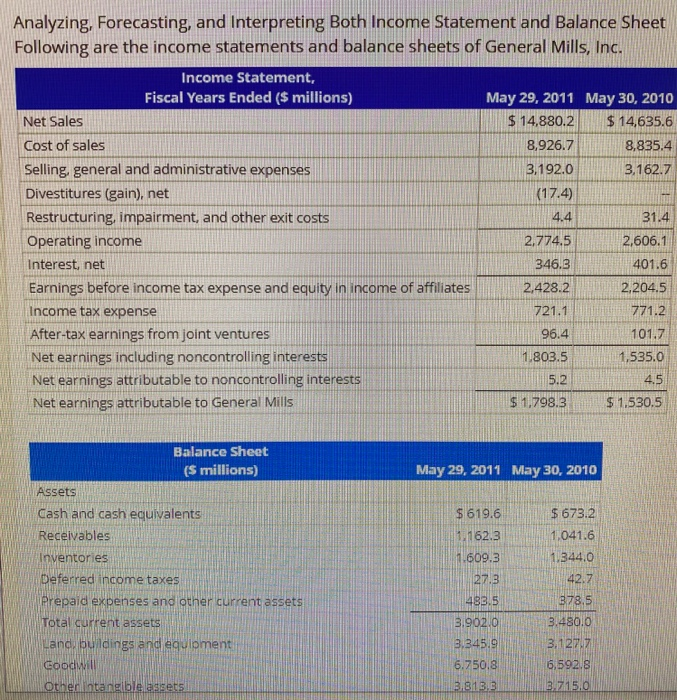
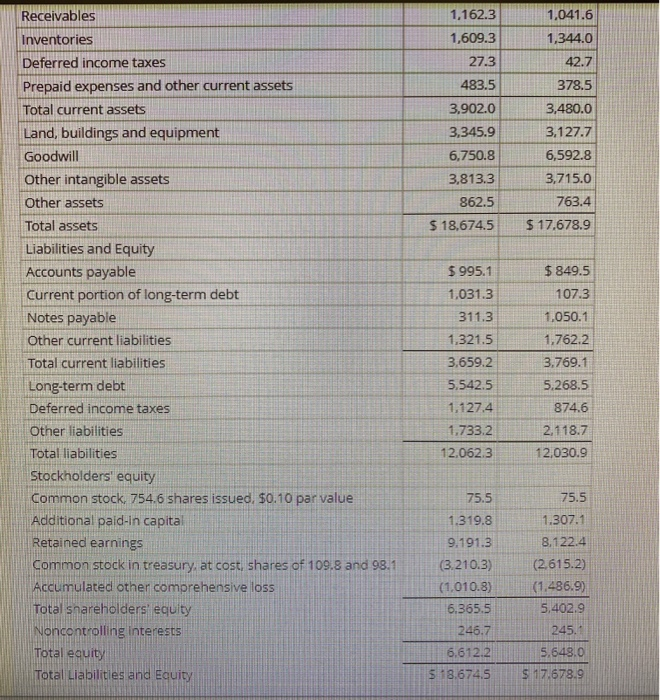
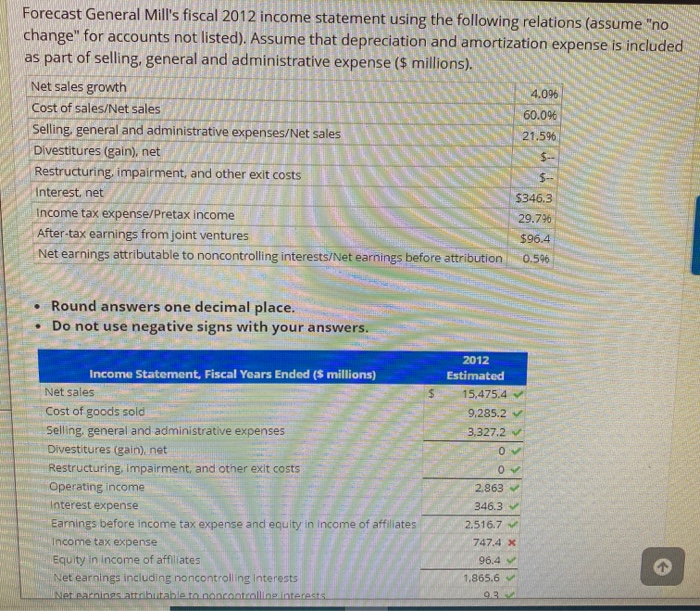
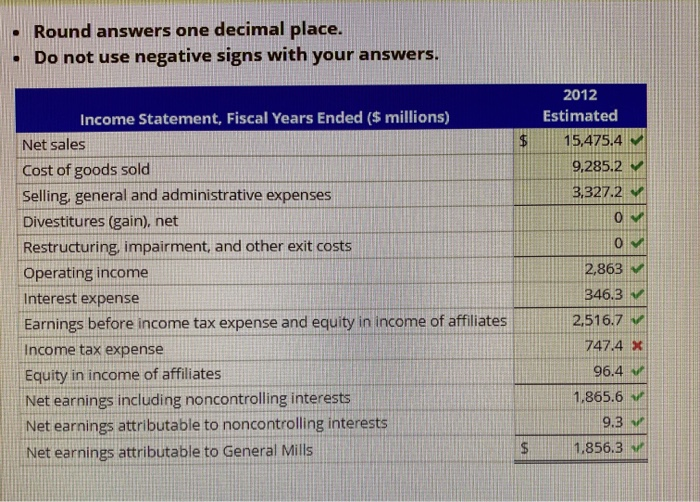
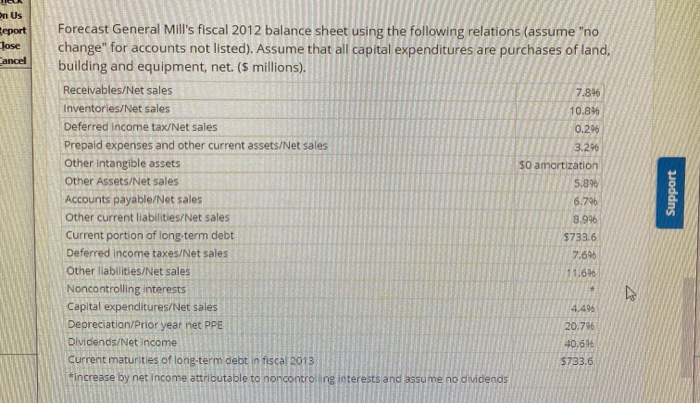
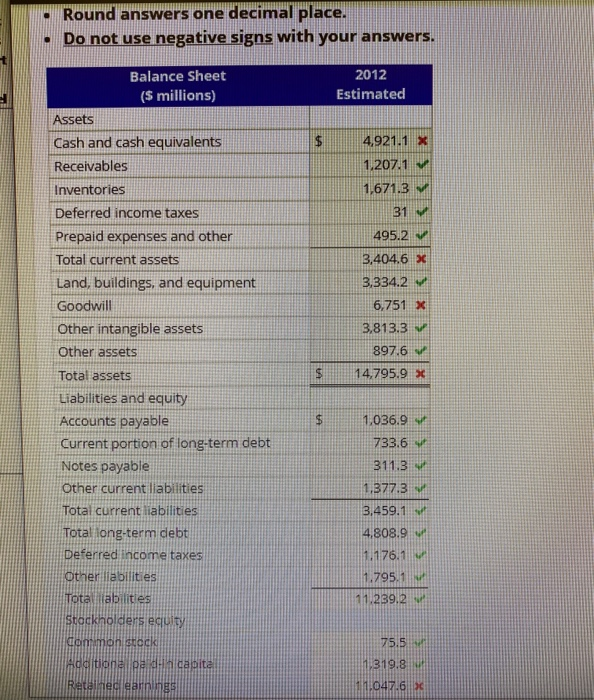
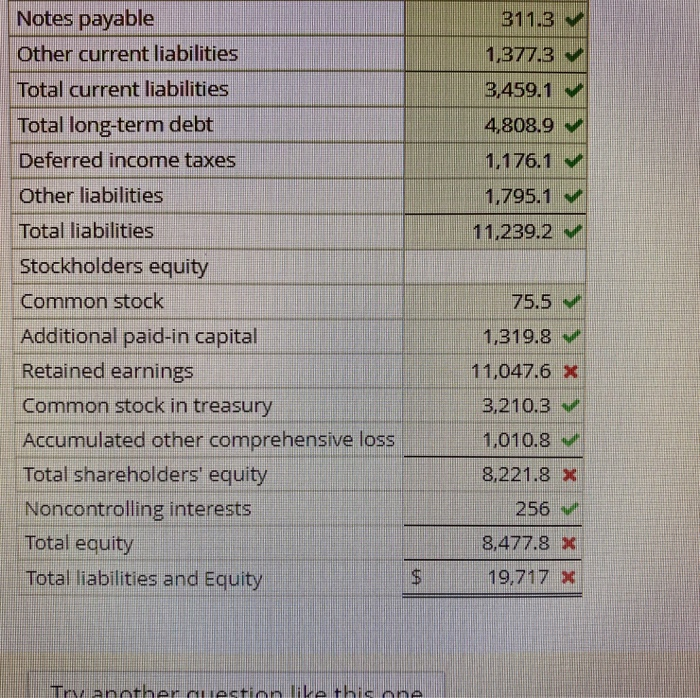
Analyzing, Forecasting, and Interpreting Both Income Statement and Balance Sheet Following are the income statements and balance sheets of General Mills, Inc. Income Statement, Fiscal Years Ended ($ millions) May 29, 2011 May 30, 2010 Net Sales $ 14,880.2 $ 14,635.6 Cost of sales 8,926.7 8,835.4 Selling general and administrative expenses 3.192.0 3.162.7 Divestitures (gain), net (17.4) Restructuring, impairment, and other exit costs 31.4 Operating income 2,774.5 2,606.1 Interest, net 346.3 401.6 Earnings before income tax expense and equity in income of affiliates 2.204.5 Income tax expense 721.1 771.2 After-tax earnings from joint ventures 96.4 101.7 Net earnings including noncontrolling interests 1.803.5 1,535.0 Net earnings attributable to noncontrolling interests 5.2 Net earnings attributable to General Mills 798.3 $ 1.530.5 2,428.2 May 29, 2011 May 30, 2010 Balance Sheet (5 millions) Assets Cash and cash equivalents Receivables Inventories Deferred income taxes Prepaid expenses and other current assets Total current assets Land, buildings and equipment Goodwill Other intangible assets $ 619.6 1.162.3 1.609.3 27.3 488.5 3.902.0 3.345.9 6.750.8 3.813 $ 673.2 1,041.6 1.344.0 42.7 378.5 3.490.0 3.12707 6,592.8 3.715,0 1,162.3 1,609.3 27.3 483.5 3.902.0 3,345.9 6,750.8 3,813.3 862.5 $ 18,674.5 1,041.6 1,344.0 42.7 378.5 3,480.0 3,127.7 6,592.8 3,715.0 763.4 $17.678.9 Receivables Inventories Deferred income taxes Prepaid expenses and other current assets Total current assets Land, buildings and equipment Goodwill Other intangible assets Other assets Total assets Liabilities and Equity Accounts payable Current portion of long-term debt Notes payable Other current liabilities Total current liabilities Long-term debt Deferred income taxes Other liabilities Total liabilities Stockholders' equity Common stock, 754.6 shares issued, $0.10 par value Additional paid-in capital Retained earnings Common stock in treasury, at cost, shares of 109.8 and 98.1 Accumulated other comprehensive loss Total shareholders equity Noncontrolling interests Total equity Total Liabilities and Equity $995.1 1,031.3 311.3 1.321.5 3.659.2 5.542.5 1,127.4 1,733.2 12.062.3 $849.5 107.3 1,050.1 1.762.2 3.769.1 5.268.5 874.6 2.118.7 12.030.9 75.5 1.319.8 9.191.3 (3.210.3) (1.010.8) 6.365.5 246.7 6.612.2 5 13.6745 75.5 11.307.1 8.122.4 (2.615.2) (1,486.9) 5,402.9 245.1 643.0 $17.678.9 4.0% Forecast General Mill's fiscal 2012 income statement using the following relations (assume "no change" for accounts not listed). Assume that depreciation and amortization expense is included as part of selling, general and administrative expense ($ millions). Net sales growth Cost of sales/Net sales 60.0% Selling, general and administrative expenses/Net sales 21.5% Divestitures (gain), net Restructuring, impairment, and other exit costs Interest.net Income tax expense/Pretax income 29.796 After-tax earnings from joint ventures Net earnings attributable to noncontrolling interests/Net earnings before attribution S- $346,3 $96.4 0.596 Round answers one decimal place. Do not use negative signs with your answers. Income Statement. Fiscal Years Ended (5 millions) Net sales Cost of goods sold Selling, general and administrative expenses Divestitures (gain), net Restructuring, impairment, and other exit costs Operating income Interest expense Earnings before income tax expense and equity in incom Income tax expense Equity in income of affiliates Net earnings including noncontrolling interests Net Bacines attributable to no controlling interests 2012 Estimated 15,475.4 9.285.2 3,327.2 0 0 2.863 346.3 2.516.7 747.4 x 96.4 1.865,6 incon Round answers one decimal place. Do not use negative signs with your answers. 2012 Estimated 15,475.4 9,285.2 3,327.2 Income Statement, Fiscal Years Ended ($ millions), Net sales Cost of goods sold Selling, general and administrative expenses Divestitures (gain), net Restructuring, impairment, and other exit costs Operating income Interest expense Earnings before income tax expense and equity in income of affiliates Income tax expense Equity in income of affiliates Net earnings including noncontrolling interests Net earnings attributable to noncontrolling interests Net earnings attributable to General Mills 2,863 346.3 2.516.7 747.4 x 96.4 1,865.6 9.3 1.856.3 Us eport Jose Cancel Forecast General Mill's fiscal 2012 balance sheet using the following relations (assume "no change" for accounts not listed). Assume that all capital expenditures are purchases of land, building and equipment, net. (5 millions). Receivables/Net sales 7.89 Inventories/Net sales 10.89 Deferred income tax/Net sales 0.296 Prepaid expenses and other current assets/Net sales 3.296 Other intangible assets 50 amortization Other Assets/Net sales 5.896 Accounts payable/Net sales 6.79 Other current liabilities/Net sales 8.996 Current portion of long-term debt $733.6 Deferred income taxes/Net sales Other liabilities/Net sales 11.696 Noncontrolling interests Capital expenditures/Net sales 4.496 Depreciation/Prior year net PPE 20.796 Dividends/Net income 40.6% Current maturities of long-term debt in fiscal 2013 5733.6 increase by net income attributable to noncontrolling interests and assume no dividends Support 7.69 Round answers one decimal place. Do not use negative signs with your answers. 2012 Estimated 4,921.1 1,207.1 1,671.3 495,2 Balance Sheet ($ millions) Assets Cash and cash equivalents Receivables Inventories Deferred income taxes Prepaid expenses and other Total current assets Land, buildings, and equipment Goodwill Other intangible assets Other assets Total assets Liabilities and equity Accounts payable Current portion of long-term debt Notes payable Other current liabilities Total current liabilities Total long-term debt Deferred income taxes Other liabilities Total liabilities stockholders equity common stock itiona pa din capita 3,404.6 x 3,334.2 6,751 3,813.3 897.6 14,795.9 % 1,036.9 733.6 311.3 1.377.3 3,459.1 4.808.9 11.239.2 75.5. 1319.8 11047 61 311.3 1,377.3 3,459.1 4,808.9 1,176.1 1,795.1 V 11,239.2 V Notes payable Other current liabilities Total current liabilities Total long-term debt Deferred income taxes Other liabilities Total liabilities Stockholders equity Common stock Additional paid-in capital Retained earnings Common stock in treasury Accumulated other comprehensive loss Total shareholders' equity Noncontrolling interests Total equity Total liabilities and Equity 75.5 V 1,319.8 11,047.6 x 3,210.3 1,010.8 v 8,221.8 * 256 8,477.8 19,717 > Try another question ile this one Analyzing, Forecasting, and Interpreting Both Income Statement and Balance Sheet Following are the income statements and balance sheets of General Mills, Inc. Income Statement, Fiscal Years Ended ($ millions) May 29, 2011 May 30, 2010 Net Sales $ 14,880.2 $ 14,635.6 Cost of sales 8,926.7 8,835.4 Selling general and administrative expenses 3.192.0 3.162.7 Divestitures (gain), net (17.4) Restructuring, impairment, and other exit costs 31.4 Operating income 2,774.5 2,606.1 Interest, net 346.3 401.6 Earnings before income tax expense and equity in income of affiliates 2.204.5 Income tax expense 721.1 771.2 After-tax earnings from joint ventures 96.4 101.7 Net earnings including noncontrolling interests 1.803.5 1,535.0 Net earnings attributable to noncontrolling interests 5.2 Net earnings attributable to General Mills 798.3 $ 1.530.5 2,428.2 May 29, 2011 May 30, 2010 Balance Sheet (5 millions) Assets Cash and cash equivalents Receivables Inventories Deferred income taxes Prepaid expenses and other current assets Total current assets Land, buildings and equipment Goodwill Other intangible assets $ 619.6 1.162.3 1.609.3 27.3 488.5 3.902.0 3.345.9 6.750.8 3.813 $ 673.2 1,041.6 1.344.0 42.7 378.5 3.490.0 3.12707 6,592.8 3.715,0 1,162.3 1,609.3 27.3 483.5 3.902.0 3,345.9 6,750.8 3,813.3 862.5 $ 18,674.5 1,041.6 1,344.0 42.7 378.5 3,480.0 3,127.7 6,592.8 3,715.0 763.4 $17.678.9 Receivables Inventories Deferred income taxes Prepaid expenses and other current assets Total current assets Land, buildings and equipment Goodwill Other intangible assets Other assets Total assets Liabilities and Equity Accounts payable Current portion of long-term debt Notes payable Other current liabilities Total current liabilities Long-term debt Deferred income taxes Other liabilities Total liabilities Stockholders' equity Common stock, 754.6 shares issued, $0.10 par value Additional paid-in capital Retained earnings Common stock in treasury, at cost, shares of 109.8 and 98.1 Accumulated other comprehensive loss Total shareholders equity Noncontrolling interests Total equity Total Liabilities and Equity $995.1 1,031.3 311.3 1.321.5 3.659.2 5.542.5 1,127.4 1,733.2 12.062.3 $849.5 107.3 1,050.1 1.762.2 3.769.1 5.268.5 874.6 2.118.7 12.030.9 75.5 1.319.8 9.191.3 (3.210.3) (1.010.8) 6.365.5 246.7 6.612.2 5 13.6745 75.5 11.307.1 8.122.4 (2.615.2) (1,486.9) 5,402.9 245.1 643.0 $17.678.9 4.0% Forecast General Mill's fiscal 2012 income statement using the following relations (assume "no change" for accounts not listed). Assume that depreciation and amortization expense is included as part of selling, general and administrative expense ($ millions). Net sales growth Cost of sales/Net sales 60.0% Selling, general and administrative expenses/Net sales 21.5% Divestitures (gain), net Restructuring, impairment, and other exit costs Interest.net Income tax expense/Pretax income 29.796 After-tax earnings from joint ventures Net earnings attributable to noncontrolling interests/Net earnings before attribution S- $346,3 $96.4 0.596 Round answers one decimal place. Do not use negative signs with your answers. Income Statement. Fiscal Years Ended (5 millions) Net sales Cost of goods sold Selling, general and administrative expenses Divestitures (gain), net Restructuring, impairment, and other exit costs Operating income Interest expense Earnings before income tax expense and equity in incom Income tax expense Equity in income of affiliates Net earnings including noncontrolling interests Net Bacines attributable to no controlling interests 2012 Estimated 15,475.4 9.285.2 3,327.2 0 0 2.863 346.3 2.516.7 747.4 x 96.4 1.865,6 incon Round answers one decimal place. Do not use negative signs with your answers. 2012 Estimated 15,475.4 9,285.2 3,327.2 Income Statement, Fiscal Years Ended ($ millions), Net sales Cost of goods sold Selling, general and administrative expenses Divestitures (gain), net Restructuring, impairment, and other exit costs Operating income Interest expense Earnings before income tax expense and equity in income of affiliates Income tax expense Equity in income of affiliates Net earnings including noncontrolling interests Net earnings attributable to noncontrolling interests Net earnings attributable to General Mills 2,863 346.3 2.516.7 747.4 x 96.4 1,865.6 9.3 1.856.3 Us eport Jose Cancel Forecast General Mill's fiscal 2012 balance sheet using the following relations (assume "no change" for accounts not listed). Assume that all capital expenditures are purchases of land, building and equipment, net. (5 millions). Receivables/Net sales 7.89 Inventories/Net sales 10.89 Deferred income tax/Net sales 0.296 Prepaid expenses and other current assets/Net sales 3.296 Other intangible assets 50 amortization Other Assets/Net sales 5.896 Accounts payable/Net sales 6.79 Other current liabilities/Net sales 8.996 Current portion of long-term debt $733.6 Deferred income taxes/Net sales Other liabilities/Net sales 11.696 Noncontrolling interests Capital expenditures/Net sales 4.496 Depreciation/Prior year net PPE 20.796 Dividends/Net income 40.6% Current maturities of long-term debt in fiscal 2013 5733.6 increase by net income attributable to noncontrolling interests and assume no dividends Support 7.69 Round answers one decimal place. Do not use negative signs with your answers. 2012 Estimated 4,921.1 1,207.1 1,671.3 495,2 Balance Sheet ($ millions) Assets Cash and cash equivalents Receivables Inventories Deferred income taxes Prepaid expenses and other Total current assets Land, buildings, and equipment Goodwill Other intangible assets Other assets Total assets Liabilities and equity Accounts payable Current portion of long-term debt Notes payable Other current liabilities Total current liabilities Total long-term debt Deferred income taxes Other liabilities Total liabilities stockholders equity common stock itiona pa din capita 3,404.6 x 3,334.2 6,751 3,813.3 897.6 14,795.9 % 1,036.9 733.6 311.3 1.377.3 3,459.1 4.808.9 11.239.2 75.5. 1319.8 11047 61 311.3 1,377.3 3,459.1 4,808.9 1,176.1 1,795.1 V 11,239.2 V Notes payable Other current liabilities Total current liabilities Total long-term debt Deferred income taxes Other liabilities Total liabilities Stockholders equity Common stock Additional paid-in capital Retained earnings Common stock in treasury Accumulated other comprehensive loss Total shareholders' equity Noncontrolling interests Total equity Total liabilities and Equity 75.5 V 1,319.8 11,047.6 x 3,210.3 1,010.8 v 8,221.8 * 256 8,477.8 19,717 > Try another question ile this one