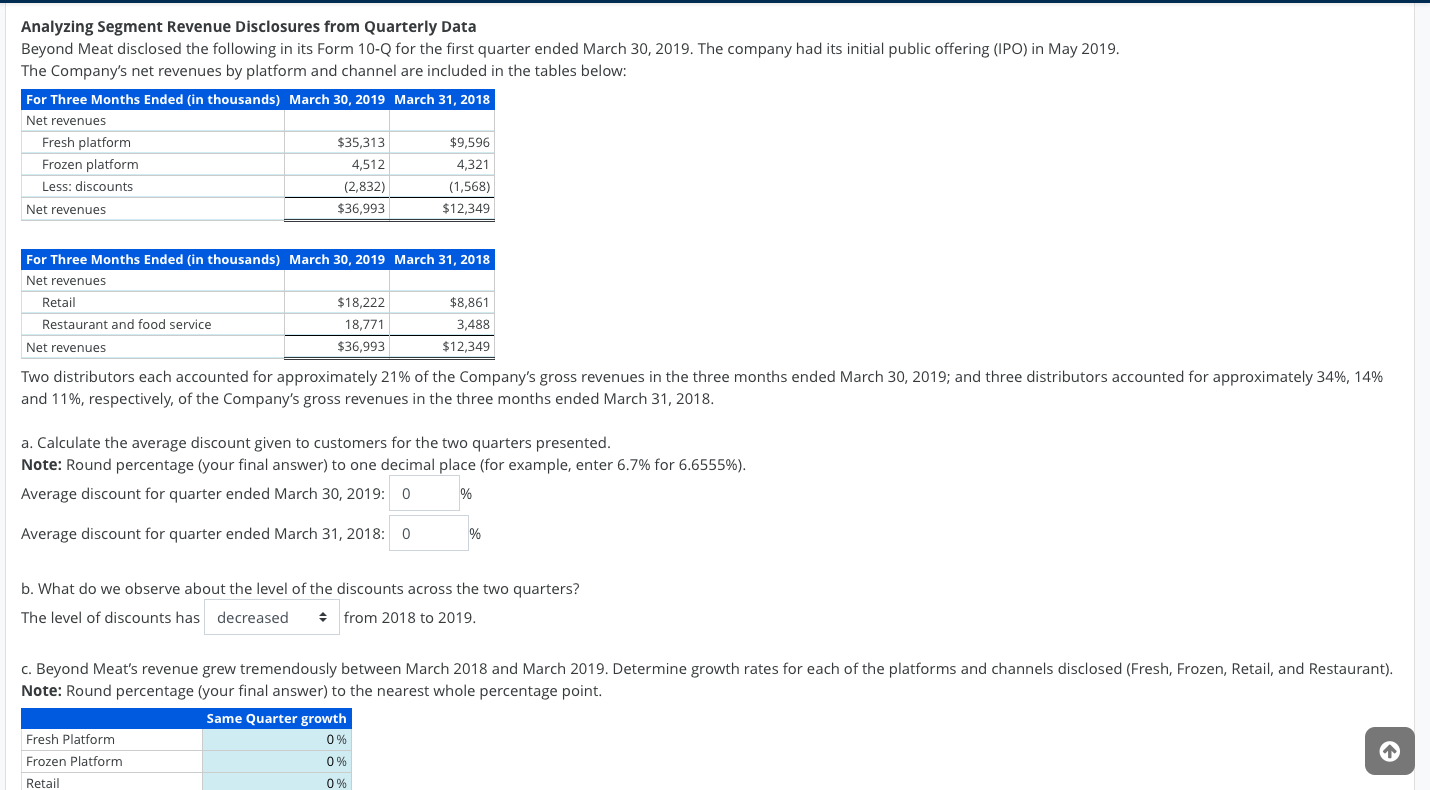
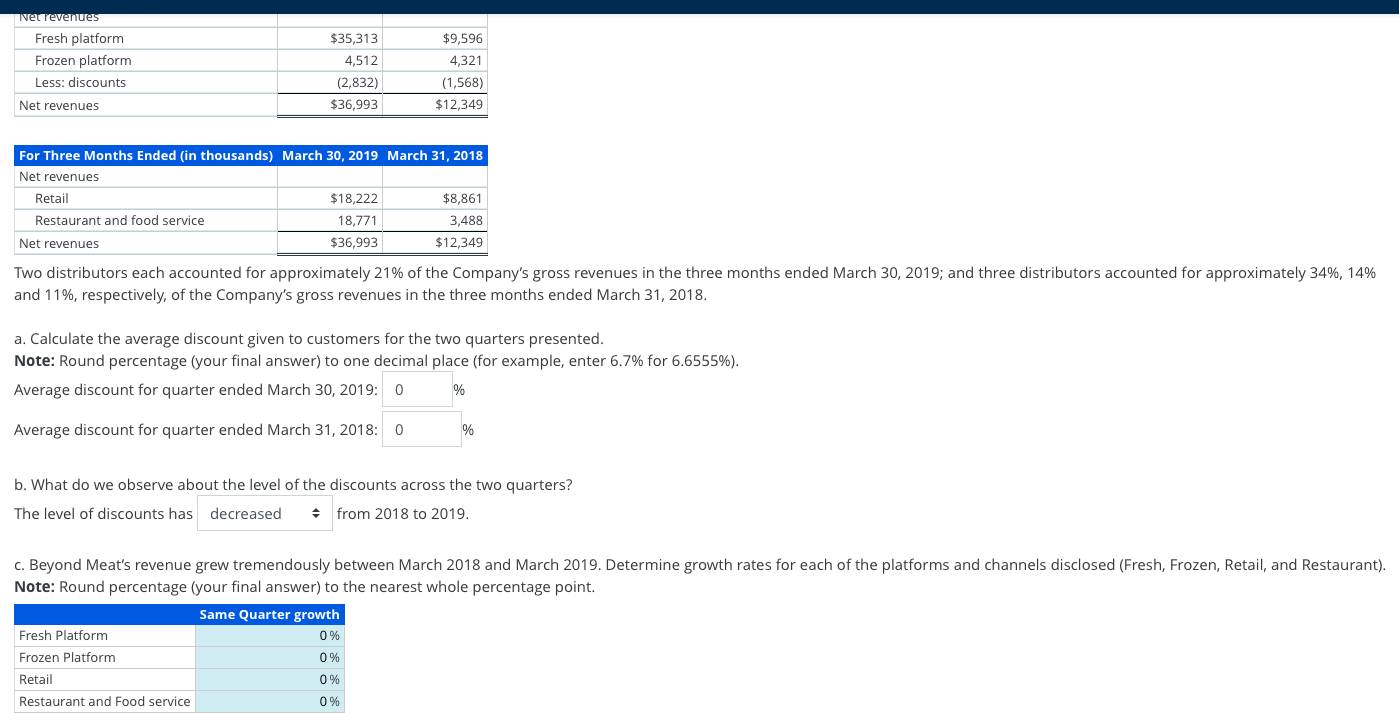
Analyzing Segment Revenue Disclosures from Quarterly Data Beyond Meat disclosed the following in its Form 10-Q for the first quarter ended March 30, 2019. The company had its initial public offering (IPO) in May 2019. The Company's net revenues by platform and channel are included in the tables below: For Three Months Ended (in thousands) March 30, 2019 March 31, 2018 Net revenues Fresh platform $35,313 $9,596 Frozen platform 4,512 4,321 Less: discounts (2,832) (1,568) Net revenues $36,993 $12,349 For Three Months Ended (in thousands) March 30, 2019 March 31, 2018 Net revenues Retail $18,222 $8,861 Restaurant and food service 18,771 3,488 Net revenues $36,993 $12,349 Two distributors each accounted for approximately 21% of the Company's gross revenues in the three months ended March 30, 2019; and three distributors accounted for approximately 34%, 14% and 11%, respectively, of the Company's gross revenues in the three months ended March 31, 2018. a. Calculate the average discount given to customers for the two quarters presented. Note: Round percentage (your final answer) to one decimal place (for example, enter 6.7% for 6.6555%). Average discount for quarter ended March 30, 2019: 0 % Average discount for quarter ended March 31, 2018: 0 % b. What do we observe about the level of the discounts across the two quarters? The level of discounts has decreased from 2018 to 2019. C. Beyond Meat's revenue grew tremendously between March 2018 and March 2019. Determine growth rates for each of the platforms and channels disclosed (Fresh, Frozen, Retail, and Restaurant). Note: Round percentage your final answer) to the nearest whole percentage point. Same Quarter growth Fresh Platform 0 % Frozen Platform 0% Retail 0 % Net revenues Fresh platform Frozen platform Less: discounts $9,596 4,321 $35,313 4,512 (2,832) $36,993 (1,568) $12,349 Net revenues For Three Months Ended (in thousands) March 30, 2019 March 31, 2018 Net revenues Retail $18,222 $8,861 Restaurant and food service 18,771 3,488 Net revenues $36,993 $12,349 Two distributors each accounted for approximately 21% of the Company's gross revenues in the three months ended March 30, 2019; and three distributors accounted for approximately 34%, 14% and 11%, respectively, of the Company's gross revenues in the three months ended March 31, 2018. a. Calculate the average discount given to customers for the two quarters presented. Note: Round percentage (your final answer) to one decimal place (for example, enter 6.7% for 6.6555%). Average discount for quarter ended March 30, 2019: 0 % Average discount for quarter ended March 31, 2018: 0 % b. What do we observe about the level of the discounts across the two quarters? The level of discounts has decreased * from 2018 to 2019. C. Beyond Meat's revenue grew tremendously between March 2018 and March 2019. Determine growth rates for each of the platforms and channels disclosed (Fresh, Frozen, Retail, and Restaurant). Note: Round percentage (your final answer) to the nearest whole percentage point. Same Quarter growth Fresh Platform 0 % Frozen Platform 0 % Retail 0% Restaurant and Food service 0 % Analyzing Segment Revenue Disclosures from Quarterly Data Beyond Meat disclosed the following in its Form 10-Q for the first quarter ended March 30, 2019. The company had its initial public offering (IPO) in May 2019. The Company's net revenues by platform and channel are included in the tables below: For Three Months Ended (in thousands) March 30, 2019 March 31, 2018 Net revenues Fresh platform $35,313 $9,596 Frozen platform 4,512 4,321 Less: discounts (2,832) (1,568) Net revenues $36,993 $12,349 For Three Months Ended (in thousands) March 30, 2019 March 31, 2018 Net revenues Retail $18,222 $8,861 Restaurant and food service 18,771 3,488 Net revenues $36,993 $12,349 Two distributors each accounted for approximately 21% of the Company's gross revenues in the three months ended March 30, 2019; and three distributors accounted for approximately 34%, 14% and 11%, respectively, of the Company's gross revenues in the three months ended March 31, 2018. a. Calculate the average discount given to customers for the two quarters presented. Note: Round percentage (your final answer) to one decimal place (for example, enter 6.7% for 6.6555%). Average discount for quarter ended March 30, 2019: 0 % Average discount for quarter ended March 31, 2018: 0 % b. What do we observe about the level of the discounts across the two quarters? The level of discounts has decreased from 2018 to 2019. C. Beyond Meat's revenue grew tremendously between March 2018 and March 2019. Determine growth rates for each of the platforms and channels disclosed (Fresh, Frozen, Retail, and Restaurant). Note: Round percentage your final answer) to the nearest whole percentage point. Same Quarter growth Fresh Platform 0 % Frozen Platform 0% Retail 0 % Net revenues Fresh platform Frozen platform Less: discounts $9,596 4,321 $35,313 4,512 (2,832) $36,993 (1,568) $12,349 Net revenues For Three Months Ended (in thousands) March 30, 2019 March 31, 2018 Net revenues Retail $18,222 $8,861 Restaurant and food service 18,771 3,488 Net revenues $36,993 $12,349 Two distributors each accounted for approximately 21% of the Company's gross revenues in the three months ended March 30, 2019; and three distributors accounted for approximately 34%, 14% and 11%, respectively, of the Company's gross revenues in the three months ended March 31, 2018. a. Calculate the average discount given to customers for the two quarters presented. Note: Round percentage (your final answer) to one decimal place (for example, enter 6.7% for 6.6555%). Average discount for quarter ended March 30, 2019: 0 % Average discount for quarter ended March 31, 2018: 0 % b. What do we observe about the level of the discounts across the two quarters? The level of discounts has decreased * from 2018 to 2019. C. Beyond Meat's revenue grew tremendously between March 2018 and March 2019. Determine growth rates for each of the platforms and channels disclosed (Fresh, Frozen, Retail, and Restaurant). Note: Round percentage (your final answer) to the nearest whole percentage point. Same Quarter growth Fresh Platform 0 % Frozen Platform 0 % Retail 0% Restaurant and Food service 0 %