

Question
and 12 Describe what is misleading in the visual display of data below World Population in Billions 12 3 4 5 6 100 4 1927
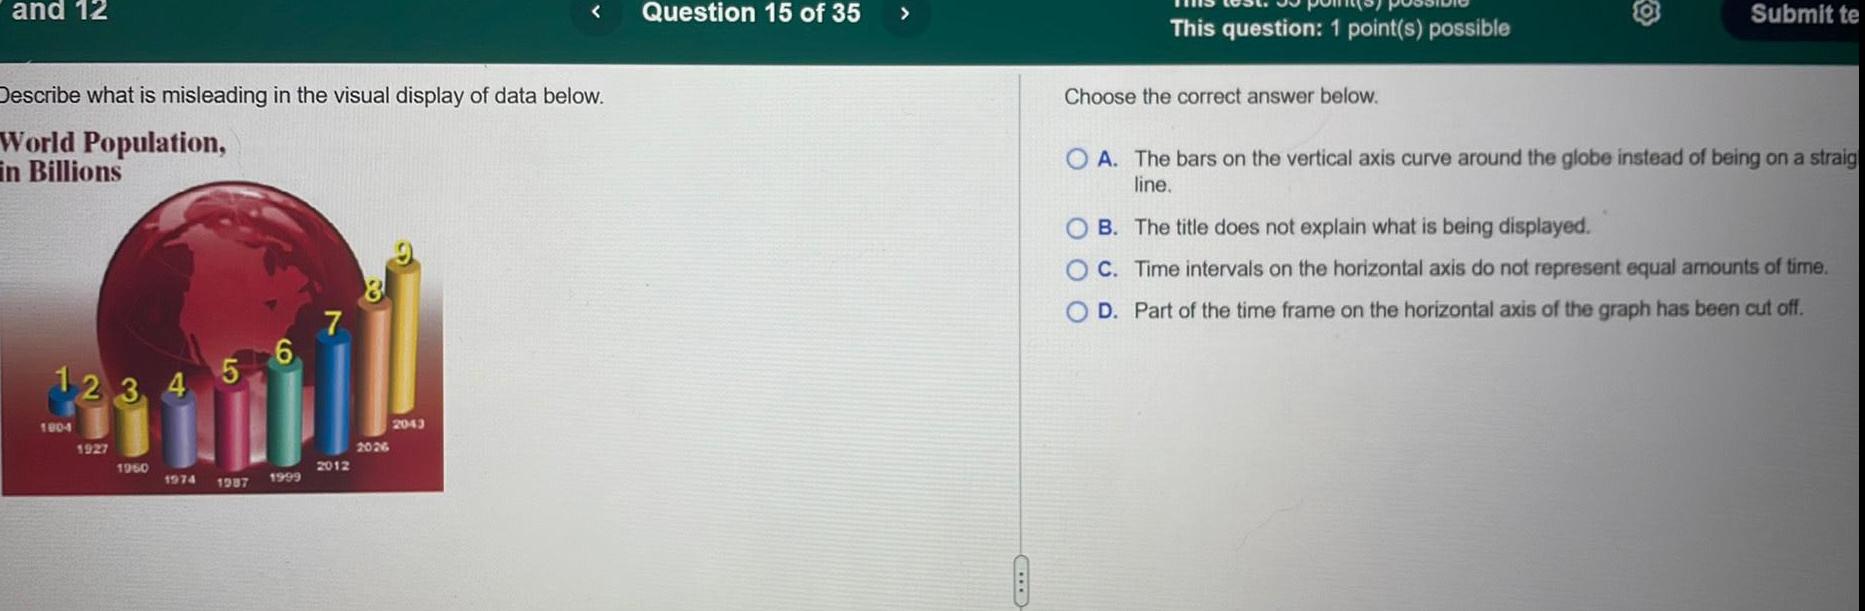

and 12 Describe what is misleading in the visual display of data below World Population in Billions 12 3 4 5 6 100 4 1927 1960 1974 1987 1999 7 2012 2026 2043 Question 15 of 35 This question 1 point s possible Choose the correct answer below Submit te OA The bars on the vertical axis curve around the globe instead of being on a straig line OB The title does not explain what is being displayed O C Time intervals on the horizontal axis do not represent equal amounts of time O D Part of the time frame on the horizontal axis of the graph has been cut off
Step by Step Solution
There are 3 Steps involved in it
Step: 1

Get Instant Access to Expert-Tailored Solutions
See step-by-step solutions with expert insights and AI powered tools for academic success
Step: 2

Step: 3
Ace Your Homework with AI
Get the answers you need in no time with our AI-driven, step-by-step assistance
Get Started
Calculus Early Transcendentals, Single Variable
Authors: Jon Rogawski
2nd Edition
1464100535, 9781464100536