

Question
Animation You will prepare a MATLAB program that generates an animation (or slide show) and saves that animation to an MPEG-4 file (having a filename
Animation You will prepare a MATLAB program that generates an animation (or slide show) and saves that animation to an MPEG-4 file (having a filename of the form *.mp4). The animation will consist of a sequence of frames, displayed at a specified number of frames per second. An example animation (slide show), Sister Cities.mp4, will be made available to you.
Your animation need not be similar to this example, but this example animation should give you an idea of the degree of complexity expected for this project. You will also prepare a document that explains the story of your animation. Each student will submit his/her own work. You may discuss this project with other students. But your submissions must be the fruit of your own labor. Instructions Your program will consist of a script m-file and at least one function m-file written by you. Script Here is an outline of the script: Assign string to myAnimation (filename, to which .mp4 will be added by MATLAB). Assign value to fps (number of frames per second). writerObj = VideoWriter(myAnimation,'MPEG-4'); writerObj.FrameRate = fps; open(writerObj); repeat the following, once per frame: { create figure frm = im2frame(A); writeVideo(writerObj, frm); close(writerObj); 2 The one-line description create figure is where the magic happens. This one-line description corresponds to multiple lines of code. Within the create figure lines-of-code will be a call to a custom function that resides in a function m-file. Your program will store the animation in an MPEG-4 file. This type of file contains, in general, compressed visual and audio information. However, for this project, you are only asked to produce a visual animation.
No audio is required. In the above script, writerObj is an object of class VideoWriter. It is not important that you understand exactly what that means. The paragraphs that follow explain as much as you will need to know about objects in MATLAB. Here is a description of the lines of code in the script: writerObj = VideoWriter(myAnimation,'MPEG-4'); The function VideoWriter creates an object of class VideoWriter whose name, in this instance, is writerObj. This object stores, within the MATLAB Workspace, properties of the animation. The animation will be saved in nonvolatile memory in an MPEG-4 file. If the variable myAnimation has the valueSister Cities, then the animation is stored in the file Sister Cities.mp4. One of the properties stored in writerObj is the filename of the video file. writerObj.FrameRate = fps; Because of the dot (*.*) notation here, you might think that this line of code references a structure and its field. But an object is more complicated than a structure, and the two should not be confused. (In a previous line of code, writerObj was created as an object of class VideoWriter, so MATLAB will not be confused about the nature of writerObj.) With objects, the dot notation references a property of the object. In this case, the property FrameRate of the object writerObj is assigned the value of the variable fps. If fps has previously been assigned the value 0.5, then the FrameRate property of writerObj becomes 0.5. open(writerObj); This method (function) opens the video file for writing video data. frm = im2frame(A); This function converts an RGB image (as represented by a three-dimensional array) into a special kind of structure known as a frame. In this case, the variable frm contains the frame. One field of the frame structure is a three-dimensional array that represents a color image.
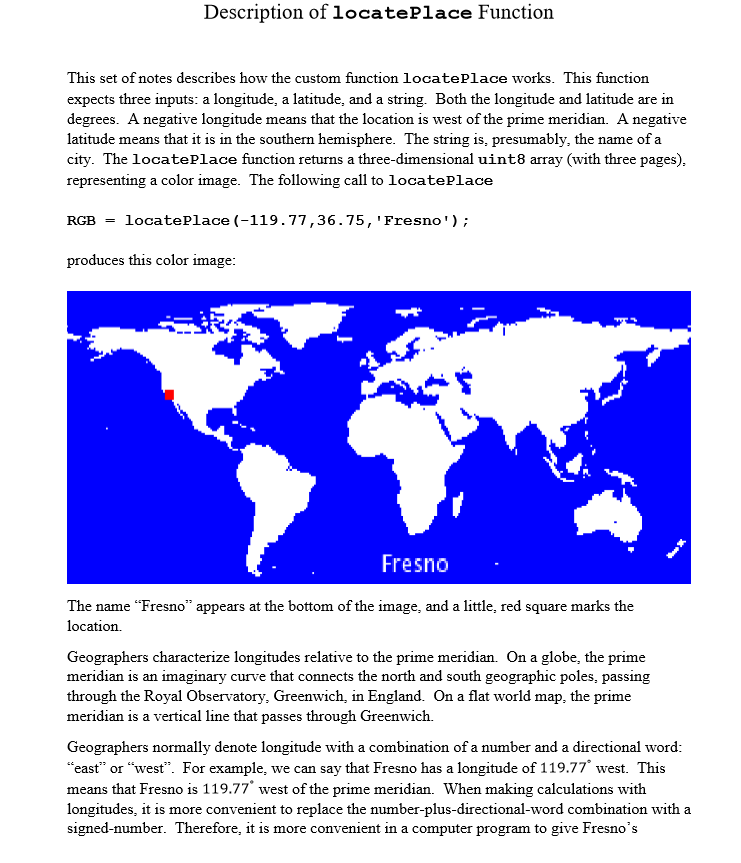
3 writeVideo(writerObj, frm); This method (function) adds the frame frm to the animation stored in the video file whose filename is stored in the object writerObj. close(writerObj); This method (function) closes the video file after writing video data. Example Function The following plot is produced by a custom function called locatePlace. The function locatePlace is shown on the next page. This figure resulted from the following call to locatePlace: locatePlace(-119.77,36.75,'Fresno, California') Functions You are required to create a custom function (residing in a function m-file) as part of this project. You may also incorporate the function locatePlace into your project. If you use locatePlace, you will have at least two custom functions in your project (locatePlace plus the custom function that you design). Please note, you are not required to use locatePlace. Running the Program When your script and function (or functions) are completed, you can execute your script from within MATLAB. This will create an *.mp4 file (if you havent made any mistakes). You can then run the animation outside of MATLAB by double-clicking the icon for your newly created *.mp4 file. 4 function RGB = locatePlace(longitude,latitude,name) % Makes a figure: world map with plotted point and title % Inputs: % longitude = signed longitude, deg (-177 to 178) % latitude = signed latitude, deg (-58 to 88) % name = placename (string) % Sign convention for longitudes and latitudes: % The prime meridian, which passes through Greenwich, % England, has longitude 0 deg. A longitude between % -180 and 0 deg is west of the prime meridian. A % longitude between 0 and +180 deg is east of the prime % meridian. A latitude between -90 and 0 deg is south % south of the equator. A latitude between 0 and +90 % is north of the equator. % How this function works: % The file topo.mat, a built-in MATLAB data file, % contains a matrix with 180 rows (one for % each integer-degree latitude -89 to 90) and 360 % columns (one for each integer-degree longitude % 0 to 359). Each element in the matrix is the % elevation above sea level in meters.
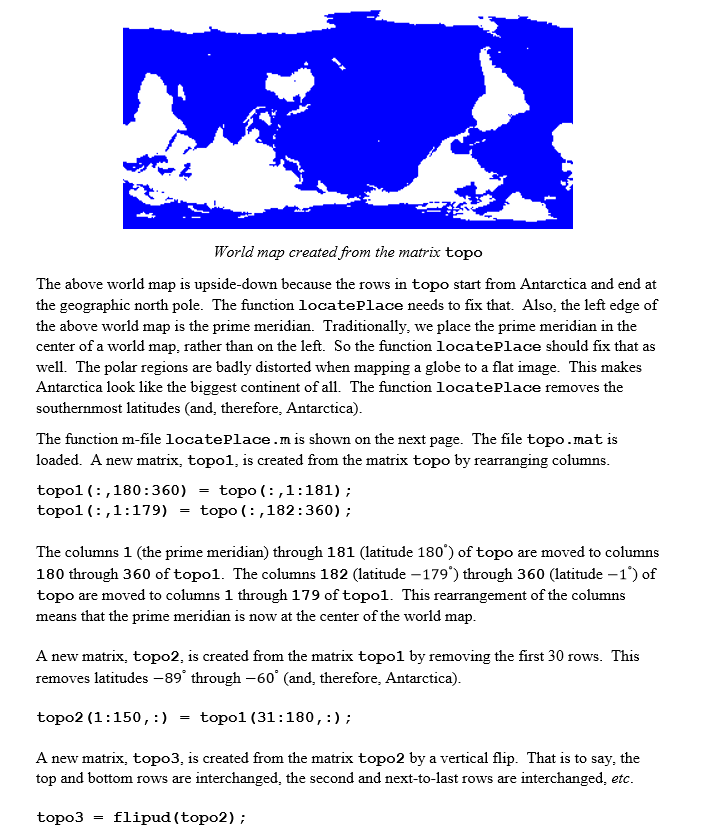
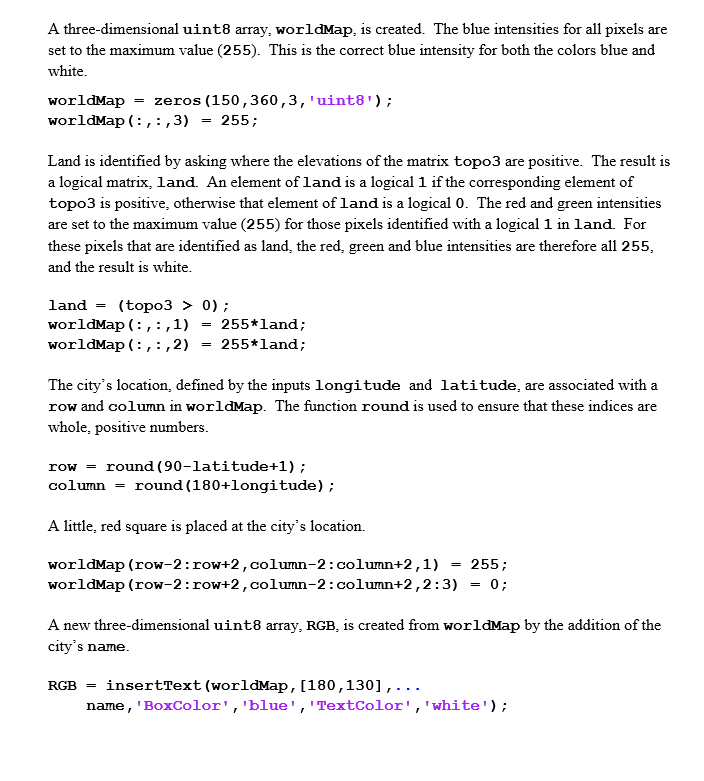
This function % reorganizes columns in the matrix so that the columns % correspond to geographers' designation of longitudes: % -179 deg to +180 deg. Antarctica is removed because % it distorts badly in the sphere-to-flat transformation. % Negative elevations, assumed to be ocean, are made blue, % and positive elevations, assumed to be land, are made % white. A red disk is added at the specified longitude % and latitude. A title is added. load topo topo1(:,180:360) = topo(:,1:181); topo1(:,1:179) = topo(:,182:360); topo2(1:150,:) = topo1(31:180,:); % Antarctica removed topo3 = flipud(topo2); % top row becomes Arctic worldMap = zeros(150,360,3,'uint8'); worldMap(:,:,3) = 255; land = (topo3 > 0); worldMap(:,:,1) = 255*land; worldMap(:,:,2) = 255*land; row = round(90-latitude+1); column = round(180+longitude); worldMap(row-2:row+2,column-2:column+2,1) = 255; worldMap(row-2:row+2,column-2:column+2,2:3) = 0; RGB = insertText(worldMap,[180,130],... name,'BoxColor','blue','TextColor','white'); end % locatePlace 5 What You Will Submit You will submit to Blackboard your published script, published function, and *.mp4 file. If you also used locatePlace, you do not need to submit that, since your instructor will already have a copy. You will also submit to Blackboard a document (preferably submitted as a PDF file) in which you tell the story of your animation. You should explain the significance of the animation and artistic considerations that went into it. Your document should be approximately one page long. Checklist: one script m-file, one function m-file, and one document (a PDF file).
Step by Step Solution
There are 3 Steps involved in it
Step: 1

Get Instant Access to Expert-Tailored Solutions
See step-by-step solutions with expert insights and AI powered tools for academic success
Step: 2

Step: 3
Ace Your Homework with AI
Get the answers you need in no time with our AI-driven, step-by-step assistance
Get Started
Postgresql 16 Administration Cookbook Solve Real World Database Administration Challenges With 180+ Practical Recipes And Best Practices
Authors: Gianni Ciolli ,Boriss Mejias ,Jimmy Angelakos ,Vibhor Kumar ,Simon Riggs
1st Edition
1835460585, 978-1835460580