

Question
ANNE GIBSON CORPORATION Balance Sheet December 31, 2016 through December 31, 2018 (Dollars in thousands) 2018 2017 2016 Assets: Current assets Cash $47,200 $46,000 $45,000
ANNE GIBSON CORPORATION Balance Sheet December 31, 2016 through December 31, 2018 (Dollars in thousands) 2018 2017 2016 Assets: Current assets Cash $47,200 $46,000 $45,000 Marketable securities 2,000 2,500 3,000 Accounts receivable (net) 131,000 128,000 127,000 Inventories 122,000 124,000 126,000 Prepaid expenses 3,000 2,500 2,000 Total current assets $305,200 $303,000 $303,000 Property, plant and equipment, net 240,000 239,000 238,000 Other assets 10,000 8,000 7,000 Total assets $555,200 $550,000 $548,000
Liabilities and stockholders' equity: Current liabilities Accounts payable $72,000 $73,000 $75,000 Accrued compensation 26,000 25,000 25,500 Income taxes 11,500 12,000 13,000 Total current liabilities $109,500 $110,000 $113,500 Long-term debt 68,000 60,000 58,000 Deferred income taxes 25,000 24,000 23,000 Stockholders' equity 352,700 356,000 353,500 Total liabilities &
stockholders' equity $555,200 $550,000 $548,000
ANNE GIBSON CORPORATION Statement of Earnings For Years Ended December 31, 2016-2018 (In thousands) 2018 2017 2016 Net sales $880,000 $910,000 $840,000 Cost of goods sold 740,000 760,000 704,000 Gross profit $140,000 $150,000 $136,000
Selling and administrative expense 53,000 52,000 50,000 Interest expense 6,700 5,900 5,800 Earnings from continuing operations before income taxes $80,300 $92,100 $80,200 Income taxes 26,000 27,500 28,000 Net earnings $54,300 $64,600 $52,200 Anne Gibson Corp. Industry Ratios Ratios Unit 2018 2017 2016 Liquidity: Current ratio times 2.79 2.75 2.67 2.5 Acid-test ratio times 1.65 1.60 1.54 1.5 Asset Management: Accounts receivable turnover Times per year 6.80 7.14 6.64 10.42 Accounts receivable turnover in days Days 53.71 51.14 54.97 35.03 Inventory turnover Times per year 6.02 6.08 5.57 5.5 Inventory turnover in days Days 60.67 60.03 65.59 66.37 Total asset turnover Times per year 1.59 1.66 1.54 1.65 Long-term debt-paying ability: Times interest earned Times per year 12.99 16.61 14.83 10.55 Debt ratio % 36.47 35.27 35.49 52.6 Profitability: Profit Margin % 6.17 7.10 6.21 7.05 Returns on assets % 9.83 11.77 9.55 10.5 Returns on equity % 15.32 18.21 14.87 16.5
Analyze each ratio in liquidity and assess Anne Gibsons liquidity position and explain how it compares with industry average.
Analyze each ratio in assets management and assess Anne Gibsons assets management position and explain how it compares with industry average.
Analyze each ratio insolvency and assess Anne Gibsons debt management position and explain how it compares with the industry average..
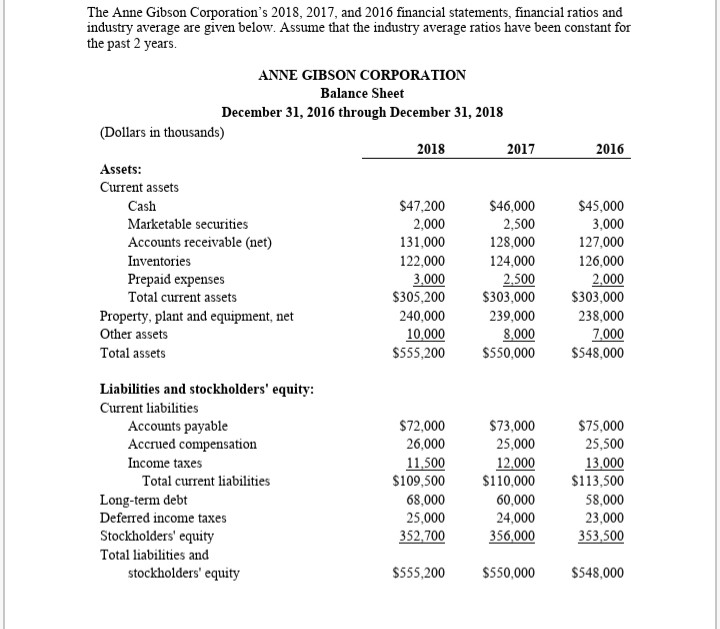
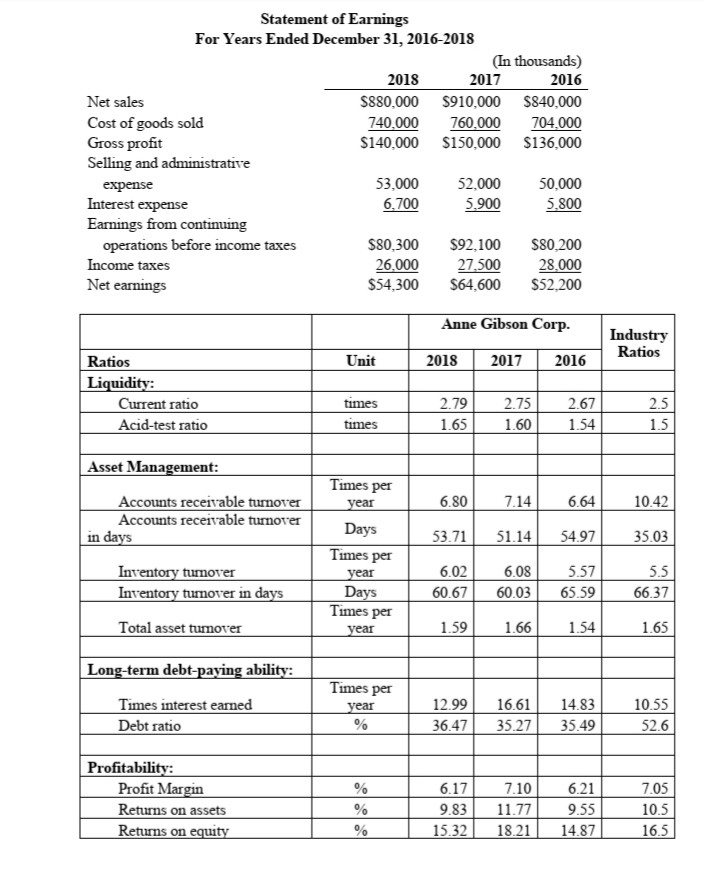
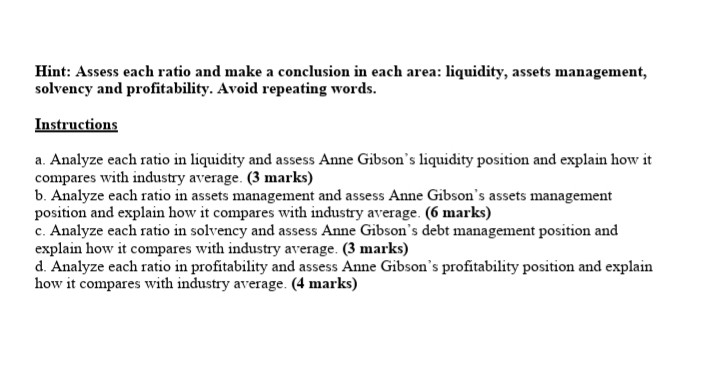
The Anne Gibson Corporation's 2018, 2017, and 2016 financial statements, financial ratios and industry average are given below. Assume that the industry average ratios have been constant for the past 2 years. 2016 ANNE GIBSON CORPORATION Balance Sheet December 31, 2016 through December 31, 2018 (Dollars in thousands) 2018 2017 Assets: Current assets Cash $47,200 $46,000 Marketable securities 2,000 2,500 Accounts receivable (net) 131,000 128,000 Inventories 122,000 124,000 Prepaid expenses 3,000 2,500 Total current assets $305,200 $303,000 Property, plant and equipment, net 240,000 239,000 Other assets 10,000 8,000 Total assets $555,200 $550,000 $45,000 3,000 127,000 126.000 2,000 $303,000 238,000 7,000 $548,000 Liabilities and stockholders' equity: Current liabilities Accounts payable Accrued compensation Income taxes Total current liabilities Long-term debt Deferred income taxes Stockholders' equity Total liabilities and stockholders' equity $72,000 26,000 11,500 $109,500 68,000 25,000 352,700 25,000 12.000 $110,000 60,000 24,000 356,000 $75,000 25,500 13,000 $113,500 58,000 23,000 353,500 $555,200 $550,000 $548,000 Statement of Earnings For Years Ended December 31, 2016-2018 (In thousands) 2018 2017 2016 Net sales $880,000 $910,000 $840,000 Cost of goods sold 740.000 760,000 704.000 Gross profit $140,000 $150,000 $136,000 Selling and administrative expense 53.000 52.000 50.000 Interest expense 6,700 5.900 5.800 Earnings from continuing operations before income taxes $80,300 $92,100 $80,200 Income taxes 26.000 27,500 28.000 Net earnings $54,300 $64,600 $52,200 Anne Gibson Corp. Industry Ratios Unit 2018 2017 2016 Ratios Liquidity: Current ratio Acid-test ratio times times 1 2.79 1.65 2.75 1.60 2.67 1.54 I Asset Management: Times per year 10.42 Accounts receivable turnover Accounts receivable turnover in days 53.71 51.14 54.97 35.03 Inventory turnover Inventory turnover in days Days Times per year Days Times per 6.02 60.67 6.08 60.03 5.57 65.59 66.37 Total asset turnover year 1.59 1.66 1.54 1.65 Long-term debt-paying ability: Times per year Times interest earned Debt ratio 12.99 36.47 16.61 35.27 14.83 35.49 10.55 52.6 % 705 Profitability: Profit Margin Returns on assets Returns on equity % % 6.17 9.83 15,32 7.106 .21 11.77 9.55 18.21 14.87 16.5 Hint: Assess each ratio and make a conclusion in each area: liquidity, assets management, solvency and profitability. Avoid repeating words. Instructions a. Analyze each ratio in liquidity and assess Anne Gibson's liquidity position and explain how it compares with industry average. (3 marks) b. Analyze each ratio in assets management and assess Anne Gibson's assets management position and explain how it compares with industry average. (6 marks) c. Analyze each ratio in solvency and assess Anne Gibson's debt management position and explain how it compares with industry average. (3 marks) d. Analyze each ratio in profitability and assess Anne Gibson's profitability position and explain how it compares with industry average. (4 marks)
Step by Step Solution
There are 3 Steps involved in it
Step: 1

Get Instant Access to Expert-Tailored Solutions
See step-by-step solutions with expert insights and AI powered tools for academic success
Step: 2

Step: 3
Ace Your Homework with AI
Get the answers you need in no time with our AI-driven, step-by-step assistance
Get Started
Financial Products An Introduction Using Mathematics And Excel
Authors: Bill Dalton
1st Edition
0521863589,0511434006