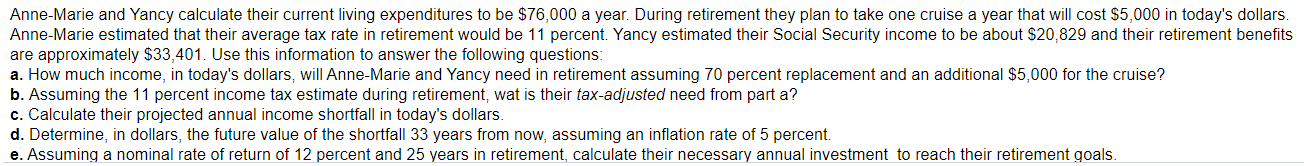
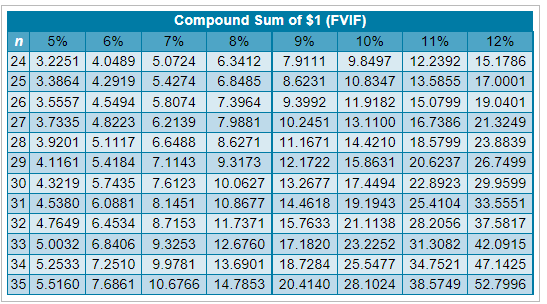
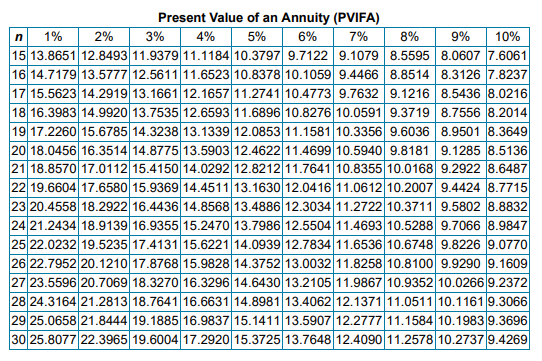
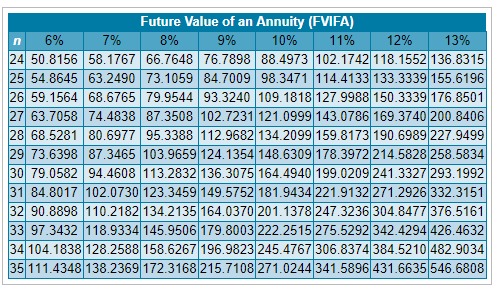
Anne-Marie and Yancy calculate their current living expenditures to be $76,000 a year. During retirement they plan to take one cruise a year that will cost $5,000 in today's dollars. Anne-Marie estimated that their average tax rate in retirement would be 11 percent. Yancy estimated their Social Security income to be about $20,829 and their retirement benefits are approximately $33,401. Use this information to answer the following questions: a. How much income, in today's dollars, will Anne-Marie and Yancy need in retirement assuming 70 percent replacement and an additional $5,000 for the cruise? b. Assuming the 11 percent income tax estimate during retirement, wat is their tax-adjusted need from part a? c. Calculate their projected annual income shortfall in today's dollars. d. Determine, in dollars, the future value of the shortfall 33 years from now, assuming an inflation rate of 5 percent. e. Assuming a nominal rate of return of 12 percent and 25 years in retirement, calculate their necessary annual investment to reach their retirement goals. Compound Sum of $1 (FVIF) n 5% 6% 7% 8% 9% 10% 11% 12% 24 3.2251 4.0489 5.0724 6.3412 7.9111 9.8497 12.2392 15.1786 25 3.3864 4.2919 5.4274 6.8485 8.6231 10.8347 13.5855 17.0001 26 3.5557 4.5494 5.8074 7.3964 9.3992 11.9182 15.0799 19.0401 27 3.7335 4.8223 6.2139 7.9881 10.2451 13.1100 16.7386 21.3249 28 3.9201 5.1117 6.6488 8.6271 11.1671 14.4210 18.5799 23.8839 29 4.1161 5.4184 7.1143 9.3173 12.1722 15.8631 20.6237 26.7499 30 4.3219 5.7435 7.6123 10.0627 13.2677 17.4494 22.8923 29.9599 31 4.5380 6.0881 8.1451 10.8677 14.4618 19.1943 25.4104 33.5551 32 4.7649 6.4534 8.7153 11.7371 | 15.7633 21.1138 28.2056 37.5817 33 5.0032 6.8406 9.3253 12.6760 | 17.1820 23.2252 31.3082 42.0915 34 5.2533 7.2510 9.9781 13.6901 | 18.7284 25.5477 34.7521 47.1425 35 5.5160 7.6861 10.6766 14.7853 20.4140 28.1024 38.5749 52.7996 n Present Value of an Annuity (PVIFA) 1% 2% 3% 4% 5% 6% 7% 8% 9% 10% 15 13.8651 12.8493 11.9379 11.1184 10.3797 9.7122 9.1079 8.5595 8.0607 7.6061 16 14.7179 13.5777 12.5611 11.6523 10.8378 10.1059 9.4466 8.8514 8.3126 7.8237 17 15.5623 14.2919 13.1661 12. 1657 11.2741 10.4773 9.7632 9.1216 8.5436 8.0216 18 16.3983 14.9920 13.7535 12.6593 11.6896 10.8276 10.0591 9.3719 8.7556 8.2014 19 17.2260 15.6785 14.3238 13.1339 12.0853 11.1581 10.3356 9.6036 8.9501 8.3649 2018.0456 16.3514 14.8775 13.5903 12.4622 11.4699 10.5940 9.8181 9.1285 8.5136 21 18.8570 17.0112 15.4150 14.0292 12.8212 11.7641 10.8355 10.0168 9.2922 8.6487 22 19.6604 17.6580 15.9369 14.4511 13.1630 12.0416 11.0612 10.2007 9.4424 8.7715 23 20.4558 18.2922 16.4436 14.8568 13.4886 12.3034 11.2722 10.3711 9.5802 8.8832 24 21.2434 18.9139 16.935515.2470 13.7986 12.5504 11.4693 10.5288 9.7066 8.9847 25 22.0232 19.5235 17.4131 15.6221 14.0939 12.7834 11.6536 10.6748 9.8226 9.0770 26 22.7952 20.121017.8768 15.9828 14.3752 13.0032 11.8258 10.8100 9.9290 9.1609 27 23.5596 20.7069 18.3270 16.3296 14.6430 13.2105 11.9867 10.9352 10.0266 9.2372 28 24.3164 21.2813 18.7641 16.6631 14.8981 13.4062 12.1371 11.0511 10.1161 9.3066 29 25.0658 21.8444 19.1885 16.9837 15.1411 13.5907 12.2777 11.1584 10.1983 9.3696 30 25.8077 22.3965 19.6004 17.2920 15.3725 13.7648 12.4090 11.2578 10.2737 9.4269 7% Future Value of an Annuity (FVIFA) n 6% 8% 9% 10% 11% 12% 13% 24 50.8156 58.1767 66.7648 76.7898 88.4973 102. 1742 118.1552 136.8315 25 54.8645 63.2490 73.1059 84.7009 98.3471 114.4133 133.3339 155.6196 26 59.1564 68.6765 79.9544 93.3240 109.1818 127.9988 150.3339 176.8501 27 63.7058 74.4838 87.3508 102.7231 121.0999 143.0786 169.3740 200.8406 28 68.5281 80.6977 95.3388 112.9682 134.2099 159.8173 190.6989 227.9499 29 73.6398 87.3465 103.9659 124.1354 148.6309 178.3972 214.5828 258.5834 30 79.0582 94.4608 113.2832 136.3075 164.4940 199.0209241.3327293.1992 31 84.8017 102.0730 123.3459 149.5752 181.9434 221.9132 271.2926 332.3151 32 90.8898 110.2182 134.2135 164.0370 201.1378 247.3236 304.8477 376.5161 33 97.3432 118.9334 145.9506 179.8003 222.2515 275.5292 342.4294 426.4632 34 104.1838 128.2588 158.6267 196.9823 245.4767 306.8374384.5210 482.9034 35 111.4348 138.2369 172.3168 215.7108 271.0244 341.5896 431.6635 546.6808