

Answered step by step
Verified Expert Solution
Question
1 Approved Answer
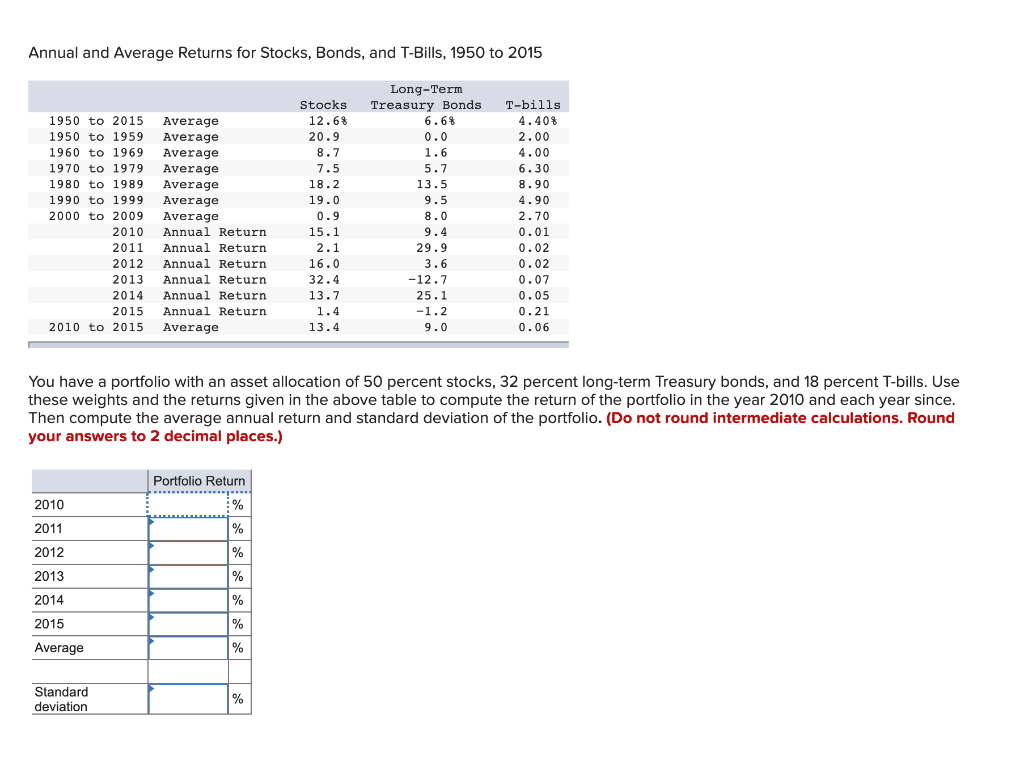
Annual and Average Returns for Stocks, Bonds, and T-Bills, 1950 to 2015 Long-Term Treasury Bonds 6.6% T-bills Stocks 1950 to 2015 Average 12.63 4.40% Average
Step by Step Solution
There are 3 Steps involved in it
Step: 1

Get Instant Access to Expert-Tailored Solutions
See step-by-step solutions with expert insights and AI powered tools for academic success
Step: 2

Step: 3
Ace Your Homework with AI
Get the answers you need in no time with our AI-driven, step-by-step assistance
Get Started
Fintech For Finance Professionals
Authors: David Kuo Chuen Lee, Joseph Lim, Kok Fai Phoon, Yu Wang
1st Edition
9811241864, 978-9811241864