

Answered step by step
Verified Expert Solution
Question
1 Approved Answer
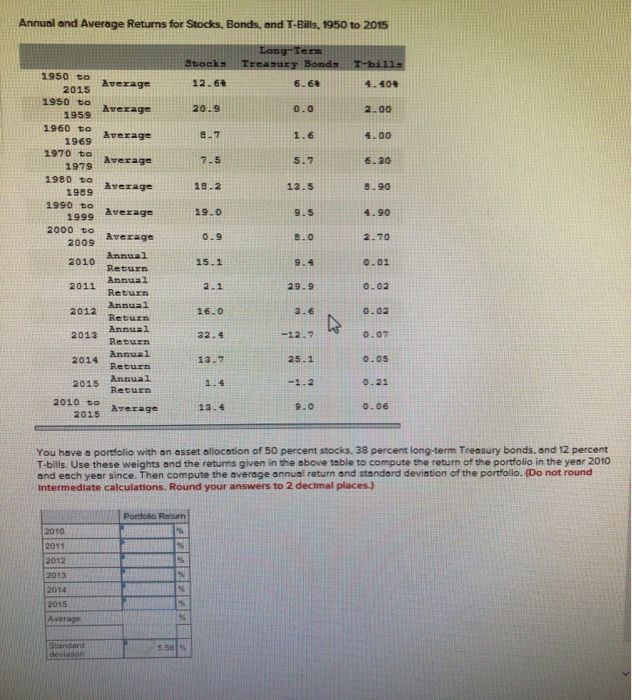
Annual and Average Returns for Stocks, Bonds, and T-Bills, 1950 to 2015 Stoeks Longter Treasury Bonds 1-bills Average 12.60 4.400 2.00 th 1950 to 2015
Step by Step Solution
There are 3 Steps involved in it
Step: 1

Get Instant Access to Expert-Tailored Solutions
See step-by-step solutions with expert insights and AI powered tools for academic success
Step: 2

Step: 3
Ace Your Homework with AI
Get the answers you need in no time with our AI-driven, step-by-step assistance
Get Started
Cash Flow Stock Investing
Authors: Randall Stewart
1st Edition
1980883300, 978-1980883302