

Answered step by step
Verified Expert Solution
Question
1 Approved Answer
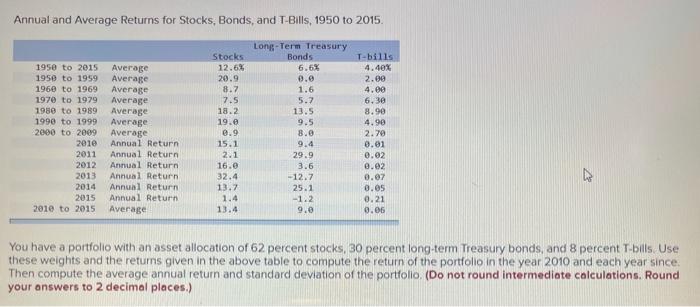
Annual and Average Returns for Stocks, Bonds, and T-Bills, 1950 to 2015. 1950 to 2015 1950 to 1959 1960 to 1969 1970 to 1979 1980
Step by Step Solution
There are 3 Steps involved in it
Step: 1

Get Instant Access to Expert-Tailored Solutions
See step-by-step solutions with expert insights and AI powered tools for academic success
Step: 2

Step: 3
Ace Your Homework with AI
Get the answers you need in no time with our AI-driven, step-by-step assistance
Get Started
Quantum Investing Unlocking The Secrets Of The New Financial System
Authors: Hugh Webb
1st Edition
979-8388948823