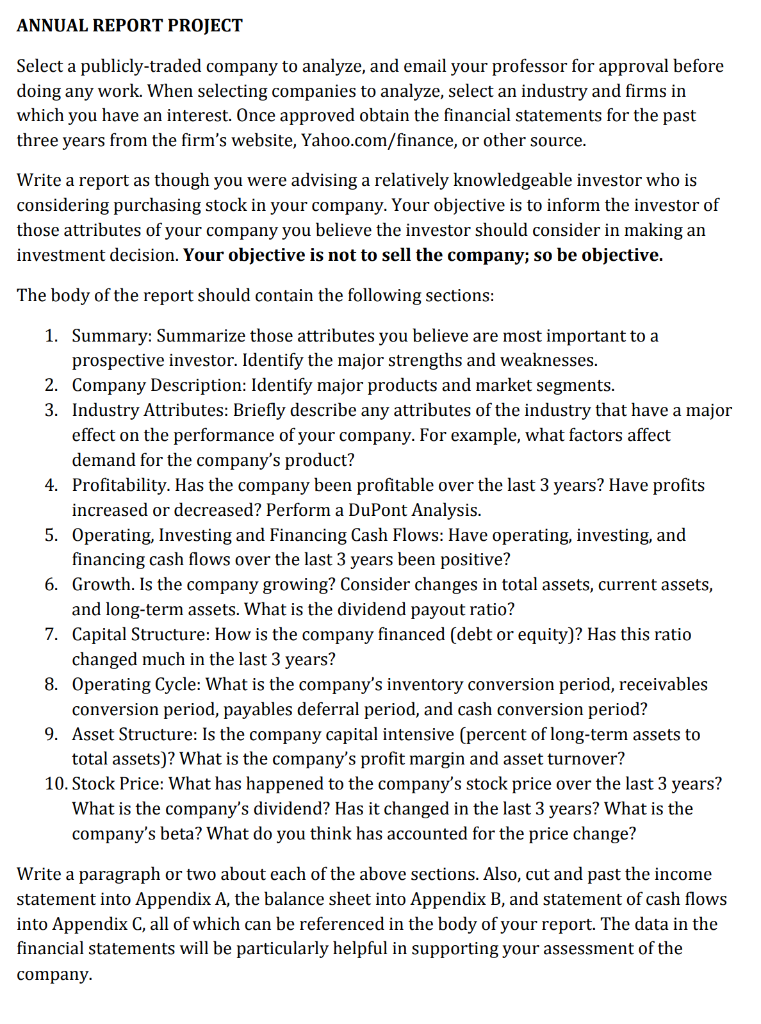
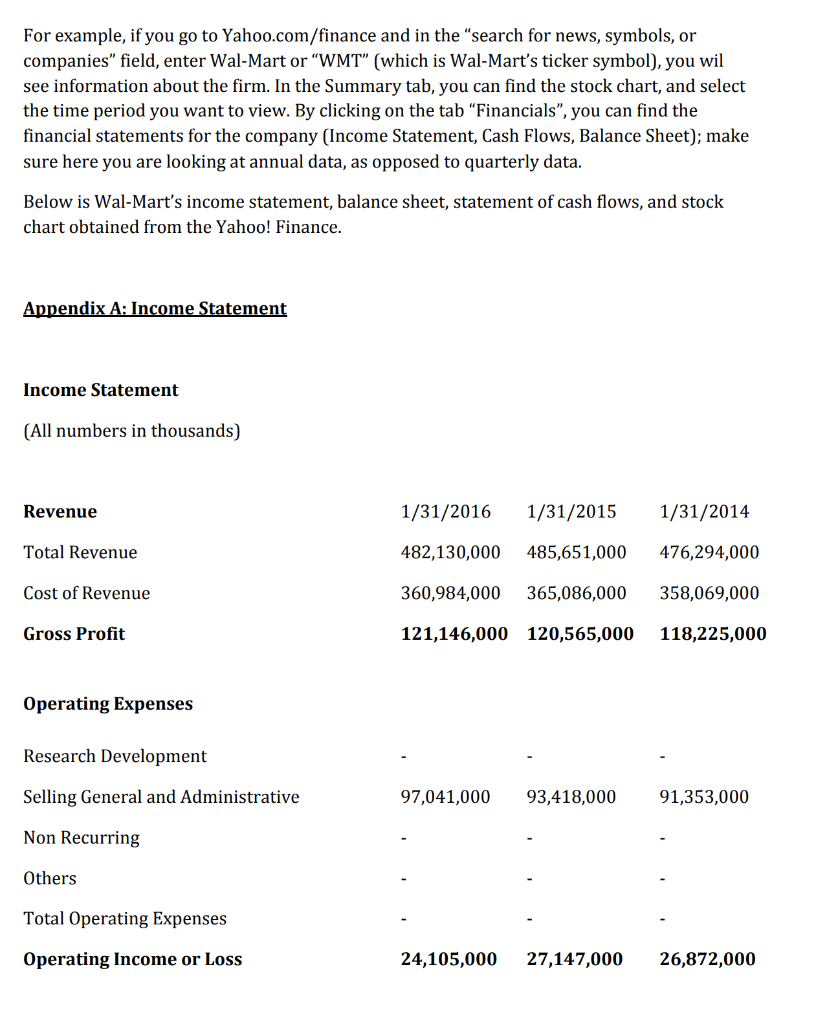
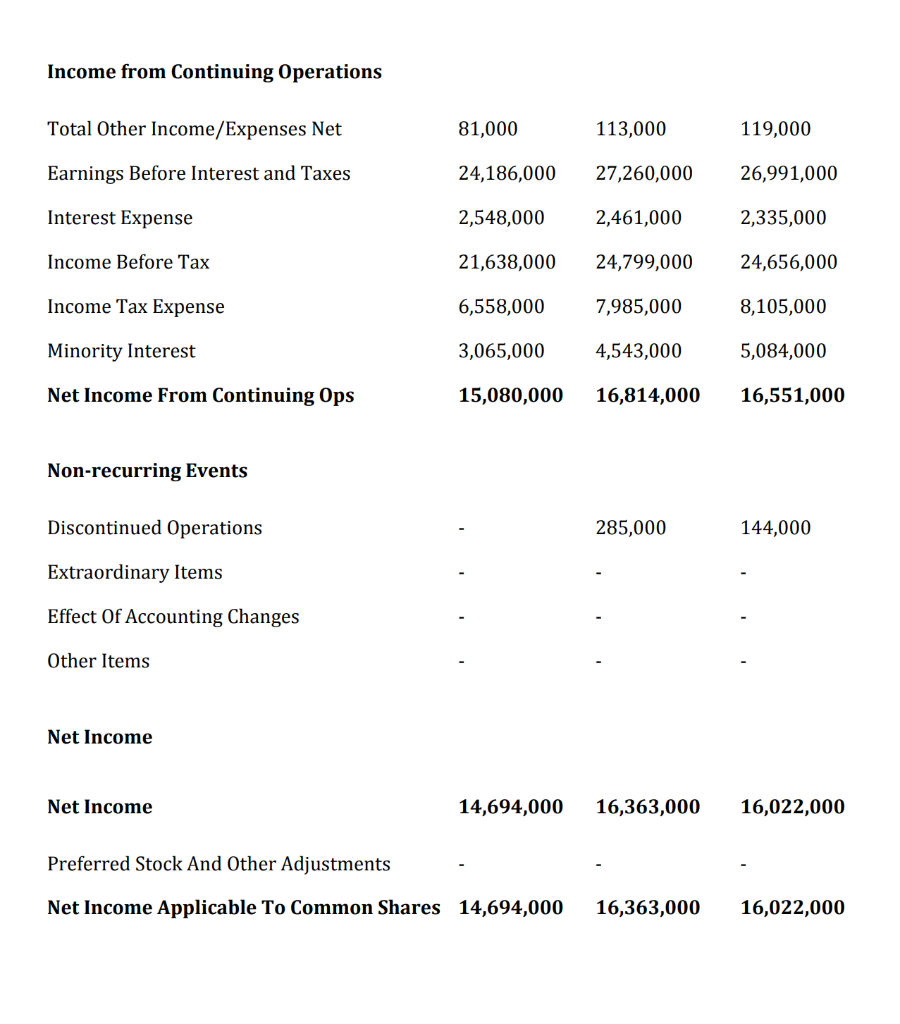
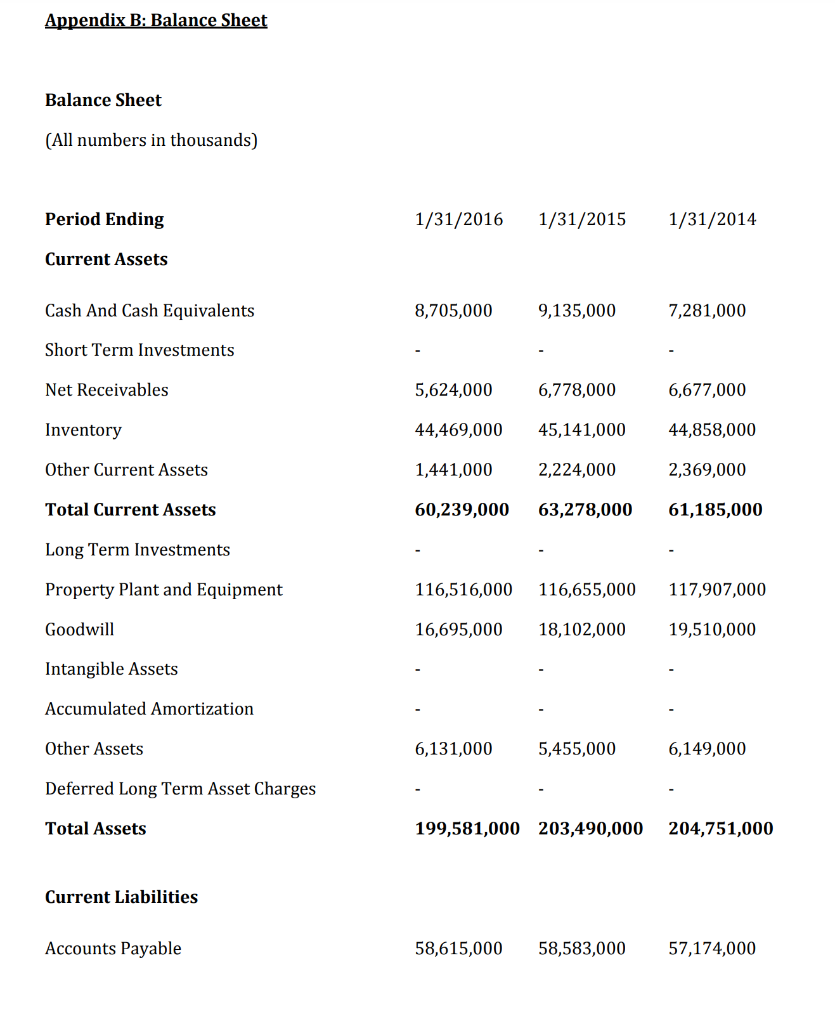
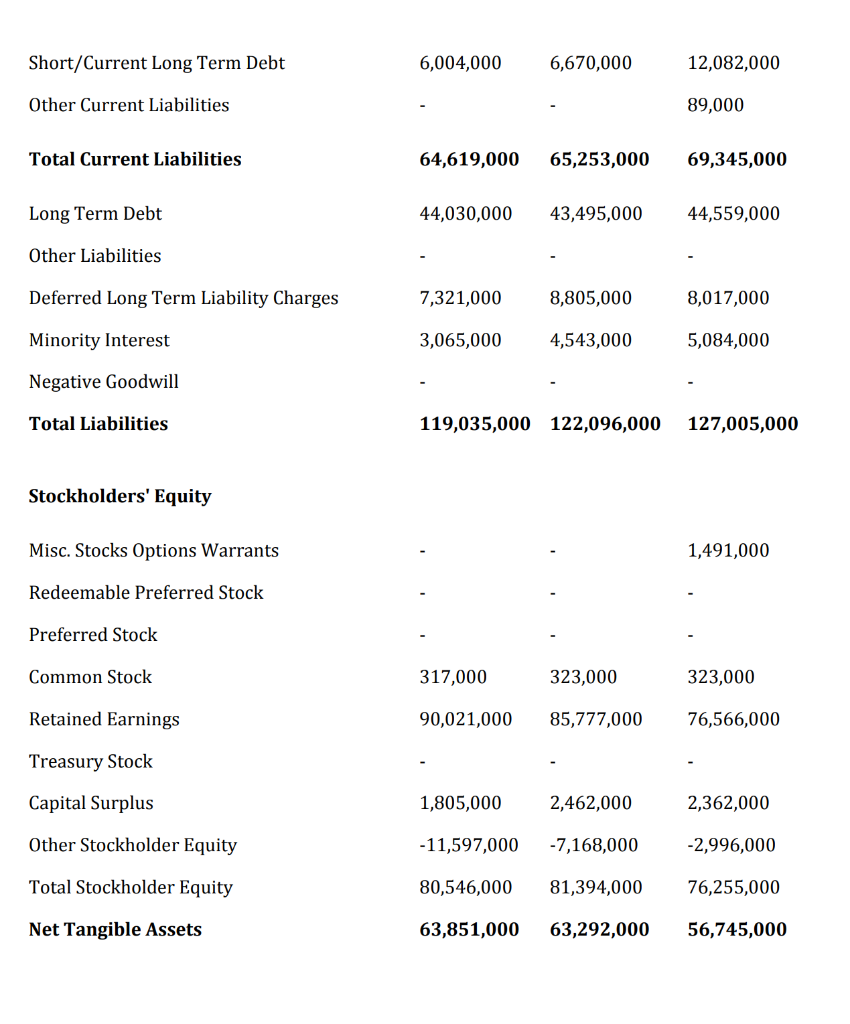
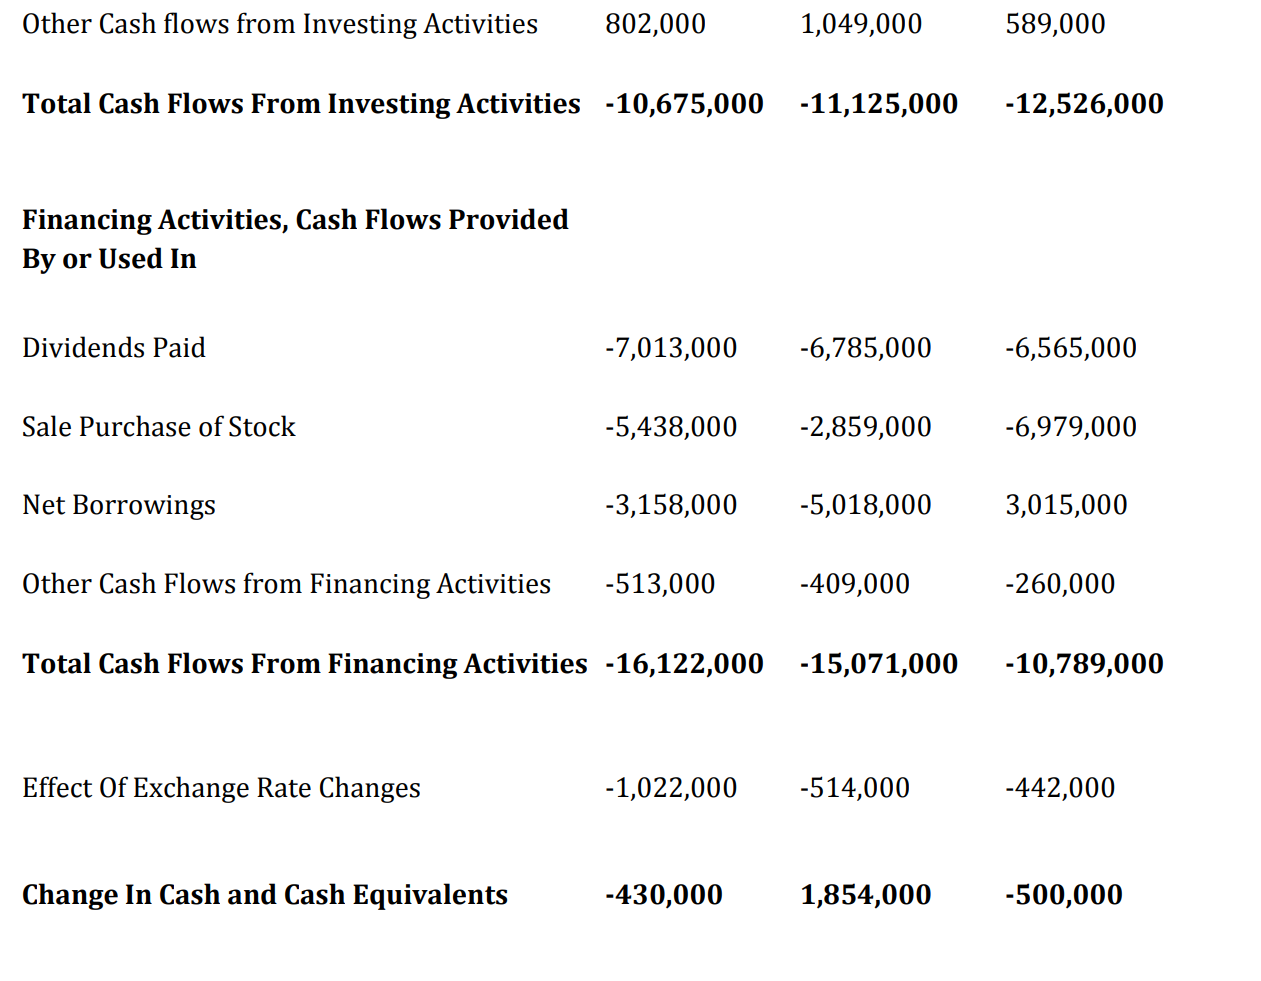
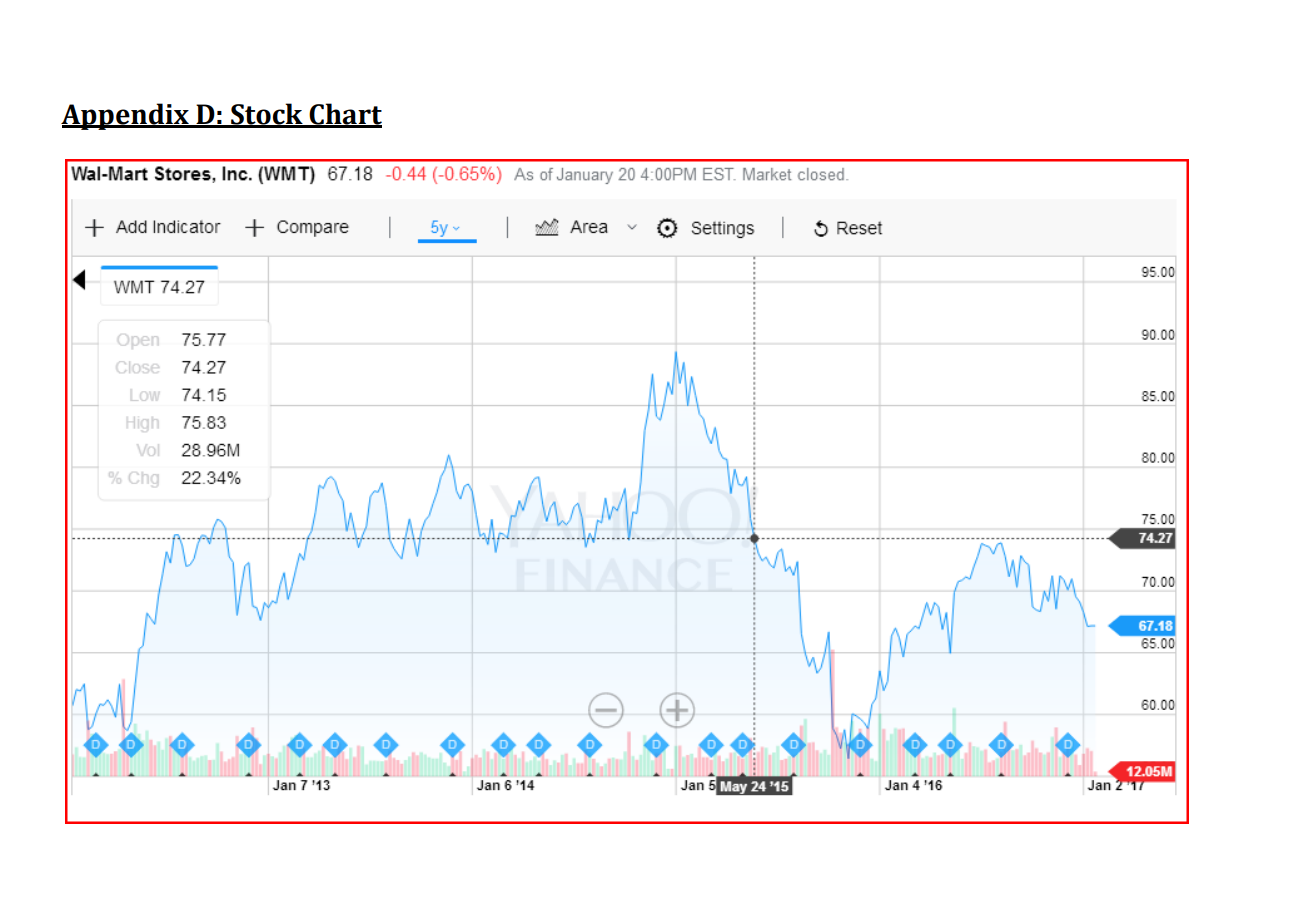
ANNUAL REPORT PROJECT Select a publicly-traded company to analyze, and email your professor for approval before doing any work. When selecting companies to analyze, select an industry and firms in which you have an interest. Once approved obtain the financial statements for the past three years from the firm's website, Yahoo.com/finance, or other source. Write a report as though you were advising a relatively knowledgeable investor who is considering purchasing stock in your company. Your objective is to inform the investor of those attributes of your company you believe the investor should consider in making an investment decision. Your objective is not to sell the company; so be objective. The body of the report should contain the following sections: 1. Summary: Summarize those attributes you believe are most important to a prospective investor. Identify the major strengths and weaknesses. 2. Company Description: Identify major products and market segments. 3. Industry Attributes: Briefly describe any attributes of the industry that have a major effect on the performance of your company. For example, what factors affect demand for the company's product? 4. Profitability. Has the company been profitable over the last 3 years? Have profits increased or decreased? Perform a DuPont Analysis. 5. Operating, Investing and Financing Cash Flows: Have operating, investing, and financing cash flows over the last 3 years been positive? 6. Growth. Is the company growing? Consider changes in total assets, current assets, and long-term assets. What is the dividend payout ratio? 7. Capital Structure: How is the company financed (debt or equity)? Has this ratio changed much in the last 3 years? 8. Operating Cycle: What is the company's inventory conversion period, receivables conversion period, payables deferral period, and cash conversion period? 9. Asset Structure: Is the company capital intensive (percent of long-term assets to total assets)? What is the company's profit margin and asset turnover? 10. Stock Price: What has happened to the company's stock price over the last 3 years? What is the company's dividend? Has it changed in the last 3 years? What is the company's beta? What do you think has accounted for the price change? Write a paragraph or two about each of the above sections. Also, cut and past the income statement into Appendix A, the balance sheet into Appendix B, and statement of cash flows into Appendix C, all of which can be referenced in the body of your report. The data in the financial statements will be particularly helpful in supporting your assessment of the company. For example, if you go to Yahoo.com/finance and in the "search for news, symbols, or companies" field, enter Wal-Mart or "WMT" (which is Wal-Mart's ticker symbol), you wil see information about the firm. In the Summary tab, you can find the stock chart, and select the time period you want to view. By clicking on the tab "Financials", you can find the financial statements for the company (Income Statement, Cash Flows, Balance Sheet); make sure here you are looking at annual data, as opposed to quarterly data. Below is Wal-Mart's income statement, balance sheet, statement of cash flows, and stock chart obtained from the Yahoo! Finance. Appendix A: Income Statement Income Statement (All numbers in thousands) Income from Continuing Operations TotalOtherIncome/ExpensesNetEarningsBeforeInterestandTaxesInterestExpenseIncomeBeforeTaxIncomeTaxExpenseMinorityInterestNetIncomeFromContinuing0ps81,00024,186,0002,548,00021,638,0006,558,0003,065,00015,080,000113,00027,260,0002,461,00024,799,0007,985,0004,543,00016,814,000119,00026,991,0002,335,00024,656,0008,105,0005,084,00016,551,000 Non-recurring Events Discontinued Operations 285,000144,000 Extraordinary Items Effect Of Accounting Changes Other Items Net Income Net Income 14,694,00016,363,00016,022,000 Preferred Stock And Other Adjustments Net Income Applicable To Common Shares 14,694,00016,363,00016,022,000 Appendix B: Balance Sheet Balance Sheet (All numbers in thousands) Period Ending 1/31/20161/31/20151/31/2014 Current Assets Cash And Cash Equivalents 8,705,0009,135,0007,281,000 Short Term Investments Net Receivables Inventory Other Current Assets Total Current Assets 60,239,00063,278,00061,185,000 Long Term Investments PropertyPlantandEquipment116,516,000116,655,000117,907,000 Goodwill 16,695,00018,102,00019,510,000 Intangible Assets Accumulated Amortization Other Assets 6,131,0005,455,0006,149,000 Deferred Long Term Asset Charges Total Assets 199,581,000203,490,000204,751,000 Current Liabilities Accounts Payable 58,615,00058,583,00057,174,000 Short/Current Long Term Debt Other Current Liabilities Total Current Liabilities Long Term Debt Other Liabilities Deferred Long Term Liability Charges Minority Interest Negative Goodwill Total Liabilities 6,004,00064,619,00044,030,0007,321,0003,065,000119,035,0006,670,00065,253,00043,495,0008,805,0004,543,000122,096,00012,082,00089,00069,345,00044,559,0008,017,0005,084,000127,005,000 Stockholders' Equity Misc. Stocks Options Warrants Redeemable Preferred Stock Preferred Stock Common Stock Retained Earnings 90,021,00085,777,00076,566,000 Treasury Stock Capital Surplus Other Stockholder Equity Total Stockholder Equity 80,546,00081,394,00076,255,000 Net Tangible Assets 63,851,00063,292,00056,745,000 OtherCashflowsfromInvestingActivities802,0001,049,000589,000 Total Cash Flows From Investing Activities 10,675,00011,125,00012,526,000 Financing Activities, Cash Flows Provided By or Used In Dividends Paid Sale Purchase of Stock 7,013,0005,438,0006,785,0002,859,0006,565,0006,979,000 Net Borrowings 3,158,0005,018,0003,015,000 Other Cash Flows from Financing Activities 513,000409,000260,000 Total Cash Flows From Financing Activities 16,122,00015,071,00010,789,000 Effect Of Exchange Rate Changes 1,022,000514,000442,000 Change In Cash and Cash Equivalents 430,0001,854,000500,000 Appendix D: Stock Chart ANNUAL REPORT PROJECT Select a publicly-traded company to analyze, and email your professor for approval before doing any work. When selecting companies to analyze, select an industry and firms in which you have an interest. Once approved obtain the financial statements for the past three years from the firm's website, Yahoo.com/finance, or other source. Write a report as though you were advising a relatively knowledgeable investor who is considering purchasing stock in your company. Your objective is to inform the investor of those attributes of your company you believe the investor should consider in making an investment decision. Your objective is not to sell the company; so be objective. The body of the report should contain the following sections: 1. Summary: Summarize those attributes you believe are most important to a prospective investor. Identify the major strengths and weaknesses. 2. Company Description: Identify major products and market segments. 3. Industry Attributes: Briefly describe any attributes of the industry that have a major effect on the performance of your company. For example, what factors affect demand for the company's product? 4. Profitability. Has the company been profitable over the last 3 years? Have profits increased or decreased? Perform a DuPont Analysis. 5. Operating, Investing and Financing Cash Flows: Have operating, investing, and financing cash flows over the last 3 years been positive? 6. Growth. Is the company growing? Consider changes in total assets, current assets, and long-term assets. What is the dividend payout ratio? 7. Capital Structure: How is the company financed (debt or equity)? Has this ratio changed much in the last 3 years? 8. Operating Cycle: What is the company's inventory conversion period, receivables conversion period, payables deferral period, and cash conversion period? 9. Asset Structure: Is the company capital intensive (percent of long-term assets to total assets)? What is the company's profit margin and asset turnover? 10. Stock Price: What has happened to the company's stock price over the last 3 years? What is the company's dividend? Has it changed in the last 3 years? What is the company's beta? What do you think has accounted for the price change? Write a paragraph or two about each of the above sections. Also, cut and past the income statement into Appendix A, the balance sheet into Appendix B, and statement of cash flows into Appendix C, all of which can be referenced in the body of your report. The data in the financial statements will be particularly helpful in supporting your assessment of the company. For example, if you go to Yahoo.com/finance and in the "search for news, symbols, or companies" field, enter Wal-Mart or "WMT" (which is Wal-Mart's ticker symbol), you wil see information about the firm. In the Summary tab, you can find the stock chart, and select the time period you want to view. By clicking on the tab "Financials", you can find the financial statements for the company (Income Statement, Cash Flows, Balance Sheet); make sure here you are looking at annual data, as opposed to quarterly data. Below is Wal-Mart's income statement, balance sheet, statement of cash flows, and stock chart obtained from the Yahoo! Finance. Appendix A: Income Statement Income Statement (All numbers in thousands) Income from Continuing Operations TotalOtherIncome/ExpensesNetEarningsBeforeInterestandTaxesInterestExpenseIncomeBeforeTaxIncomeTaxExpenseMinorityInterestNetIncomeFromContinuing0ps81,00024,186,0002,548,00021,638,0006,558,0003,065,00015,080,000113,00027,260,0002,461,00024,799,0007,985,0004,543,00016,814,000119,00026,991,0002,335,00024,656,0008,105,0005,084,00016,551,000 Non-recurring Events Discontinued Operations 285,000144,000 Extraordinary Items Effect Of Accounting Changes Other Items Net Income Net Income 14,694,00016,363,00016,022,000 Preferred Stock And Other Adjustments Net Income Applicable To Common Shares 14,694,00016,363,00016,022,000 Appendix B: Balance Sheet Balance Sheet (All numbers in thousands) Period Ending 1/31/20161/31/20151/31/2014 Current Assets Cash And Cash Equivalents 8,705,0009,135,0007,281,000 Short Term Investments Net Receivables Inventory Other Current Assets Total Current Assets 60,239,00063,278,00061,185,000 Long Term Investments PropertyPlantandEquipment116,516,000116,655,000117,907,000 Goodwill 16,695,00018,102,00019,510,000 Intangible Assets Accumulated Amortization Other Assets 6,131,0005,455,0006,149,000 Deferred Long Term Asset Charges Total Assets 199,581,000203,490,000204,751,000 Current Liabilities Accounts Payable 58,615,00058,583,00057,174,000 Short/Current Long Term Debt Other Current Liabilities Total Current Liabilities Long Term Debt Other Liabilities Deferred Long Term Liability Charges Minority Interest Negative Goodwill Total Liabilities 6,004,00064,619,00044,030,0007,321,0003,065,000119,035,0006,670,00065,253,00043,495,0008,805,0004,543,000122,096,00012,082,00089,00069,345,00044,559,0008,017,0005,084,000127,005,000 Stockholders' Equity Misc. Stocks Options Warrants Redeemable Preferred Stock Preferred Stock Common Stock Retained Earnings 90,021,00085,777,00076,566,000 Treasury Stock Capital Surplus Other Stockholder Equity Total Stockholder Equity 80,546,00081,394,00076,255,000 Net Tangible Assets 63,851,00063,292,00056,745,000 OtherCashflowsfromInvestingActivities802,0001,049,000589,000 Total Cash Flows From Investing Activities 10,675,00011,125,00012,526,000 Financing Activities, Cash Flows Provided By or Used In Dividends Paid Sale Purchase of Stock 7,013,0005,438,0006,785,0002,859,0006,565,0006,979,000 Net Borrowings 3,158,0005,018,0003,015,000 Other Cash Flows from Financing Activities 513,000409,000260,000 Total Cash Flows From Financing Activities 16,122,00015,071,00010,789,000 Effect Of Exchange Rate Changes 1,022,000514,000442,000 Change In Cash and Cash Equivalents 430,0001,854,000500,000 Appendix D: Stock Chart