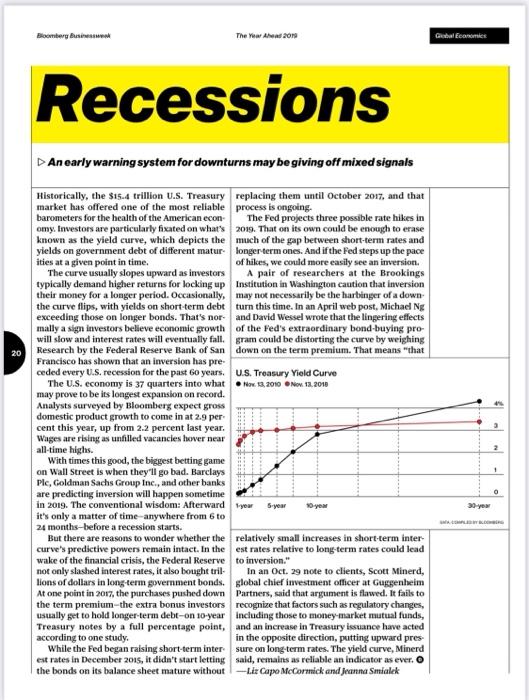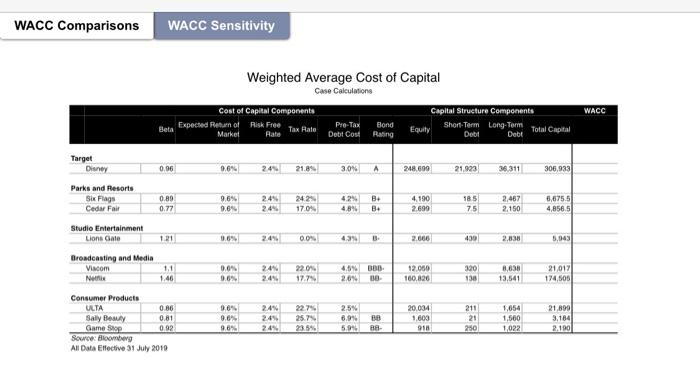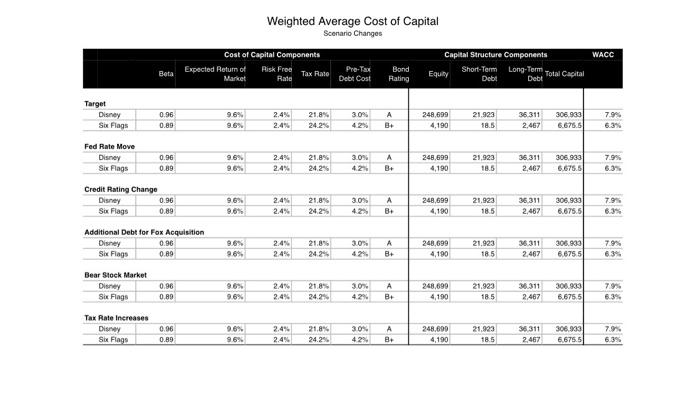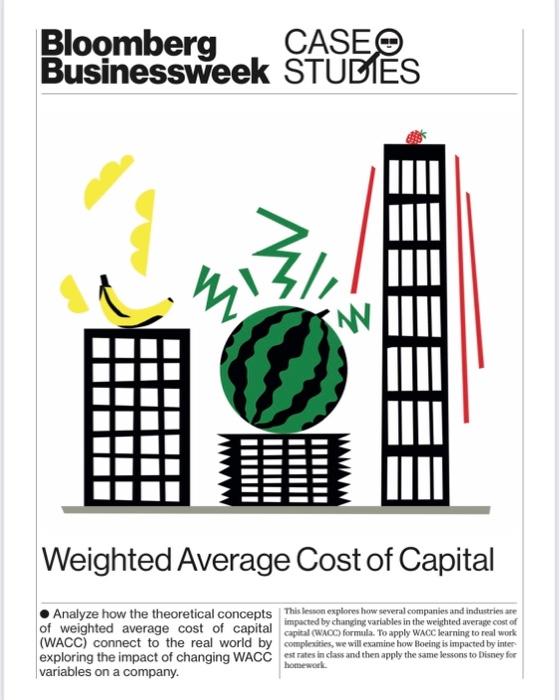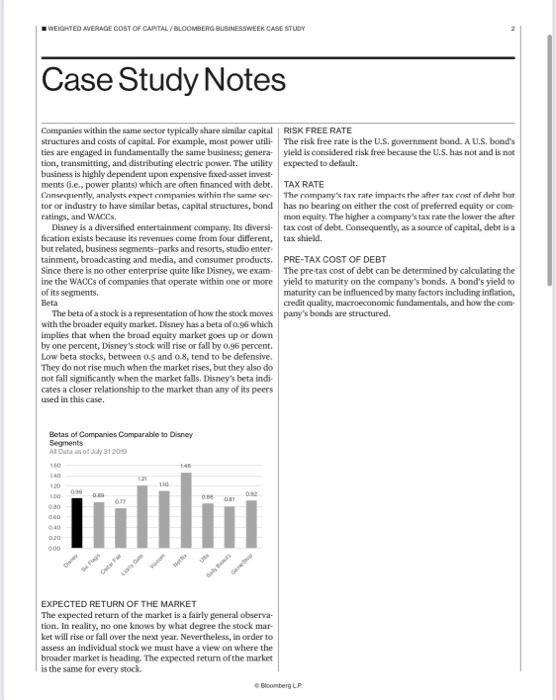
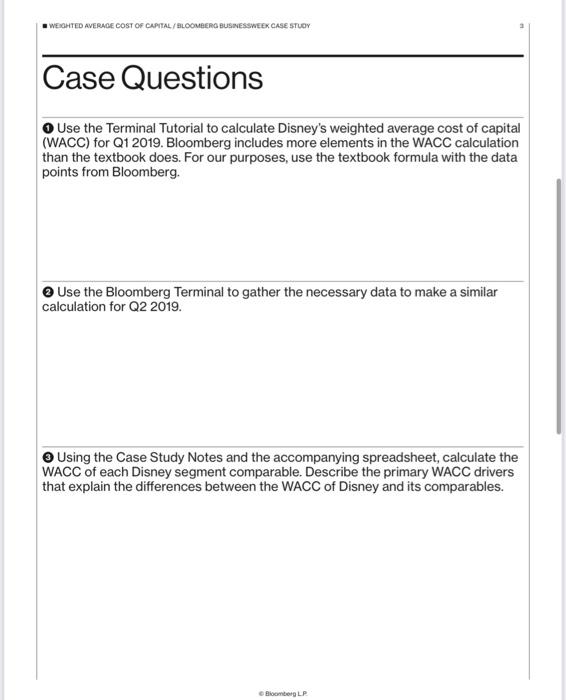
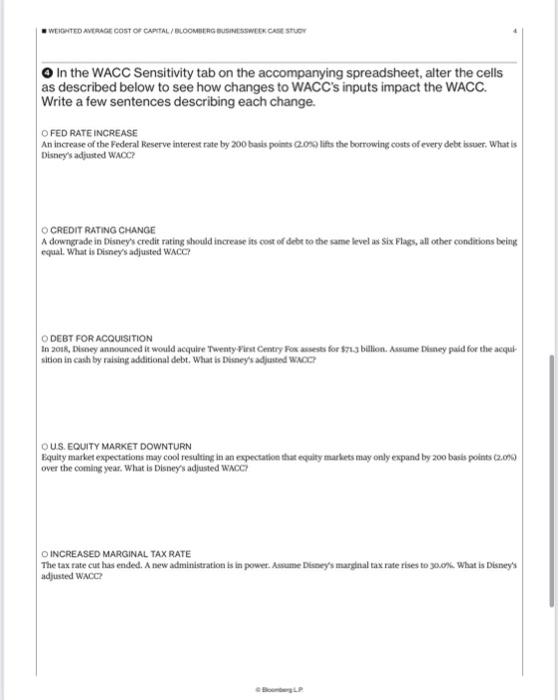
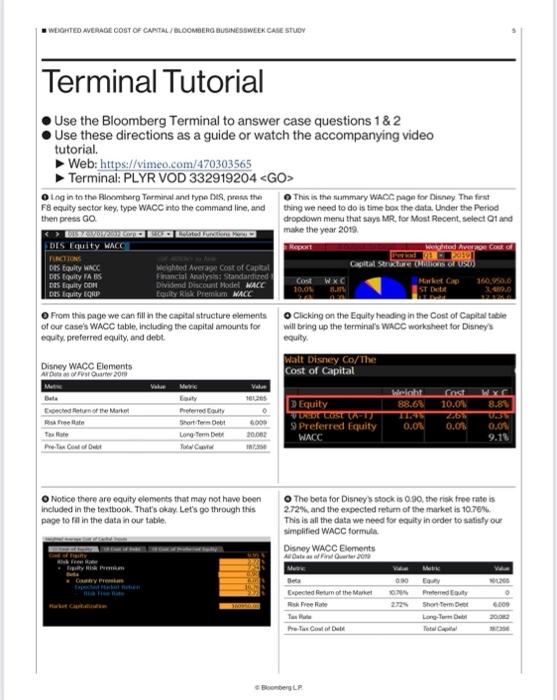
20 Bloomberg Businessweek Recessions The Year Ahead 2019 An early warning system for downturns may be giving off mixed signals Historically, the $15.4 trillion U.S. Treasury market has offered one of the most reliable barometers for the health of the American econ- omy. Investors are particularly fixated on what's known as the yield curve, which depicts the yields on government debt of different matur- ities at a given point in time. The curve usually slopes upward as investors typically demand higher returns for locking up their money for a longer period. Occasionally, the curve flips, with yields on short-term debt exceeding those on longer bonds. That's nor- mally a sign investors believe economic growth will slow and interest rates will eventually fall. Research by the Federal Reserve Bank of San Francisco has shown that an inversion has pre- ceded every U.S. recession for the past 60 years. The U.S. economy is 37 quarters into what may prove to be its longest expansion on record. Analysts surveyed by Bloomberg expect gross domestic product growth to come in at 2.9 per cent this year, up from 2.2 percent last year. Wages are rising as unfilled vacancies hover near all-time highs. But there are reasons to wonder whether the curve's predictive powers remain intact. In the wake of the financial crisis, the Federal Reserve not only slashed interest rates, it also bought tril- lions of dollars in long-term government bonds. At one point in 2017, the purchases pushed down the term premium-the extra bonus investors usually get to hold longer-term debt-on 10-year Treasury notes by a full percentage point, according to one study. replacing them until October 2017, and that process is ongoing. The Fed projects three possible rate hikes in 2019. That on its own could be enough to erase much of the gap between short-term rates and longer term ones. And if the Fed steps up the pace of hikes, we could more easily see an inversion. A pair of researchers at the Brookings Institution in Washington caution that inversion may not necessarily be the harbinger of a down- turn this time. In an April web post, Michael Ng and David Wessel wrote that the lingering effects of the Fed's extraordinary bond-buying pro- gram could be distorting the curve by weighing down on the term premium. That means "that U.S. Treasury Yield Curve Nov 13, 2010 Nov 13, 2018 With times this good, the biggest betting game on Wall Street is when they'll go bad. Barclays Plc, Goldman Sachs Group Inc., and other banks are predicting inversion will happen sometime in 2019. The conventional wisdom: Afterward-year 5-year it's only a matter of time anywhere from 6 to 24 months before a recession starts. z 10-year relatively small increases in short-term inter- est rates relative to long-term rates could lead to inversion." In an Oct. 29 note to clients, Scott Minerd, global chief investment officer at Guggenheim Partners, said that argument is flawed. It fails to recognize that factors such as regulatory changes, including those to money-market mutual funds, and an increase in Treasury issuance have acted in the opposite direction, putting upward pres sure on long-term rates. The yield curve, Minerd said, remains as reliable an indicator as ever. O While the Fed began raising short-term inter- est rates in December 2015, it didn't start letting the bonds on its balance sheet mature without-Liz Capo McCormick and Jeanna Smialek Global Economics 30-year 1 0 WACC Comparisons Target Disney Parks and Resorts Six Flags Cedar Fair Studio Entertainment Lions Gate Broadcasting and Media Viacom Netflix Consumer Products ULTA Sally Beauty Game Stop WACC Sensitivity Beta 0.96 0.89 0.77 1.21 1.1 1.46 0.86 0.81 0.92 Source: Bloomberg All Data Effective 31 July 2019 Cost of Capital Components Risk Free Rate Tax Rate Expected Return of Market 9.6% 9.6% 9.6% 9.6% 0.0% 9.6% Weighted Average Cost of Capital Case Calculations 9.6% 9.6% 9.6% 24% 2.4% 24.2% 2.4% 17.0% 2.4% 21.8% 2.4% 2.4% 24% 0.0% 2.4% 22.0% 2.4% 17.7% 22.7% 25.7% 23.5% Pre-Tax Debt Cost Bond Rating 3.0% A 4.2% B+ 4.8% B+ 4.3% B 4.5% 686. 2.6% 08- 2.5% 6.9% 88 5.9% 88- Capital Structure Components Short-Term Long-Term Debt Debt Equity 248.699 4,190 2.699 2.666 12.050 160.826 20.034 1,600 918 21,923 18.5 7.5 439 36.311 211 21 250 2,467 2,150 2.838 320 8,638 138 13,541 1,654 1,560 1,022 Total Capital 306,933 6,675.5 4,856.5 5,043 21,017 174,505 21,899 3,184 2.190 WACC Target Disney Six Flags Fed Rate Move Disney Six Flags Credit Rating Change Disney Six Flags Bear Stock Market Disney Six Flags Beta Tax Rate Increases Disney Six Flags 0.96 0.89 0.96 0.89 0.96 0.89 Additional Debt for Fox Acquisition Disney 0.96 Six Flags 0.89 0.96 0.89 0.96 0.89 Expected Return of Market Cost of Capital Components Tax Rate 9.6% 9.6% 9.6% 9.6% 9.6% 9.6% 9.6% 9.6% 9.6% 9.6% Weighted Average Cost of Capital Scenario Changes 9.6% 9.6% Risk Free Rate 2.4% 2.4% 2.4% 21.8% 2.4% 24.2% 2.4% 2.4% 21,8% 24.2% 21.8% 24.2% 2.4% 21.8% 2.4% 24.2% 2.4% 2.4% 2.4% 21.8% 2.4% 24.2% 21.8% 24.2% Pre-Tax Debt Cost 3.0% 4.2% Bond Rating A B+ 3.0% A 4.2% B+ 3.0% A 4.2% B+ 3.0% A 4.2% B+ 3.0% A 4.2% B+ 3.0% A 4.2% B+ Capital Structure Components Short-Term Long-Term Total Capital Debl Debt Equity 248,699 4,190 248,699 4,190 248,699 4,190 248,699 4,190 248,699 4,190 248,699 4,190 21.923 18.5 21,923 18.5 21,923 18.5 21,923 18.5 21.923 18.5 21,923 18.5 36.311 306.933 2,467 6.675.5 36.311 306,933 2,467 6,675.5 36,311 2,467 306,933 6.675.5 36.311 306,933 2,467 6.675.5 36.311 306.933 2,467 6.675.5 36,311 306.933 2,467 6.675.5 WACC 7.9% 6.3% 7.9% 6.3% 7.9% 6.3% 7.9% 6.3% 7.9% 6.3% 7.9% 6.3% CASE Bloomberg Businessweek STUDIES 21 III Weighted Average Cost of Capital impacted by changing variables in the weighted average cost of Analyze how the theoretical concepts This lesson explores how several companies and industries are of weighted average cost of capital (WACC) connect to the real world by exploring the impact of changing WACC variables on a company. capital (WACC) formula. To apply WACC learning to real work complexities, we will examine how Boeing is impacted by inter est rates in class and then apply the same lessons to Disney for homework WEIGHTED AVERAGE COST OF CAPITAL/BLOOMBERG BUSINESSWEEK CASE STUDY Case Study Notes Companies within the same sector typically share similar capital | RISK FREE RATE structures and costs of capital. For example, most power utili ties are engaged in fundamentally the same business; genera- tion, transmitting, and distributing electric power. The utility business is highly dependent upon expensive fixed-asset invest ments 6.e., power plants) which are often financed with debt. Consequently, analysts expect companies within the same see tor or industry to have similar betas, capital structures, bond ratings, and WACCS. Disney is a diversified entertainment company. Its diversi fication exists because its revenues come from four different, but related, business segments-parks and resorts, studio enter tainment, broadcasting and media, and consumer products. Since there is no other enterprise quite like Disney, we exam. ine the WACCs of companies that operate within one or more of its segments. Beta The beta of a stock is a representation of how the stock moves with the broader equity market. Disney has a beta of 0.96 which implies that when the broad equity market goes up or down by one percent, Disney's stock will rise or fall by 0.96 percent. Low beta stocks, between 0.5 and 0.8, tend to be defensive. They do not rise much when the market rises, but they also do not fall significantly when the market falls. Disney's beta indi cates a closer relationship to the market than any of its peers used in this case. Betas of Companies Comparable to Disney Segments A Data as of July 31 2010 140 140 120 0:30 0:40 0:40 0:20 000 0:00 0.89 6.77 LIG 1:40 epis 0.00 081 EXPECTED RETURN OF THE MARKET The expected return of the market is a fairly general observa- tion. In reality, no one knows by what degree the stock mar- ket will rise or fall over the next year. Nevertheless, in order to assess an individual stock we must have a view on where the broader market is heading. The expected return of the market is the same for every stock. The risk free rate is the U.S. government bond. A U.S. bond's yield is considered risk free because the U.S. has not and is not expected to default. TAX RATE The company's tax rate impacts the after tax cost of debt bur has no bearing on either the cost of preferred equity or com- mon equity. The higher a company's tax rate the lower the after tax cost of debt. Consequently, as a source of capital, debt is a tax shield. PRE-TAX COST OF DEBT The pre-tax cost of debt can be determined by calculating the yield to maturity on the company's bonds. A bond's yield to maturity can be influenced by many factors including inflation, credit quality, macroeconomic fundamentals, and how the com pany's bonds are structured. Bloomberg LP WEIGHTED AVERAGE COST OF CAPITAL/BLOOMBERG BUSINESSWEEK CASE STUDY Case Questions Use the Terminal Tutorial to calculate Disney's weighted average cost of capital (WACC) for Q1 2019. Bloomberg includes more elements in the WACC calculation than the textbook does. For our purposes, use the textbook formula with the data points from Bloomberg. Use the Bloomberg Terminal to gather the necessary data to make a similar calculation for Q2 2019. Using the Case Study Notes and the accompanying spreadsheet, calculate the WACC of each Disney segment comparable. Describe the primary WACC drivers that explain the differences between the WACC of Disney and its comparables. Bloomberg LP WEIGHTED AVERAGE COST OF CAPITAL/BLOOMBERG BUSINESSWEEK CASE STUDY In the WACC Sensitivity tab on the accompanying spreadsheet, alter the cells as described below to see how changes to WACC's inputs impact the WACC. Write a few sentences describing each change. OFED RATE INCREASE An increase of the Federal Reserve interest rate by 200 basis points (2.0%) lifts the borrowing costs of every debt issuer. What is Disney's adjusted WACC? O CREDIT RATING CHANGE A downgrade in Disney's credit rating should increase its cost of debt to the same level as Six Flags, all other conditions being equal. What is Disney's adjusted WACC? ODEBT FOR ACQUISITION In 2018, Disney announced it would acquire Twenty-First Centry Fox assests for $71.3 billion. Assume Disney paid for the acqui sition in cash by raising additional debt. What is Disney's adjusted WACC? OUS. EQUITY MARKET DOWNTURN Equity market expectations may cool resulting in an expectation that equity markets may only expand by 200 basis points (2.0%) over the coming year. What is Disney's adjusted WACC? O INCREASED MARGINAL TAX RATE The tax rate cut has ended. A new administration is in power. Assume Disney's marginal tax rate rises to 30.0%. What is Disney's adjusted WACC? Bonberg LP WEIGHTED AVERAGE COST OF CARTAL/BLOOMBERG BUSINESSWEEK CASE STUDY Terminal Tutorial Use the Bloomberg Terminal to answer case questions 1&2 Use these directions as a guide or watch the accompanying video tutorial. Web: https://vimeo.com/470303565 Terminal: PLYR VOD 332919204
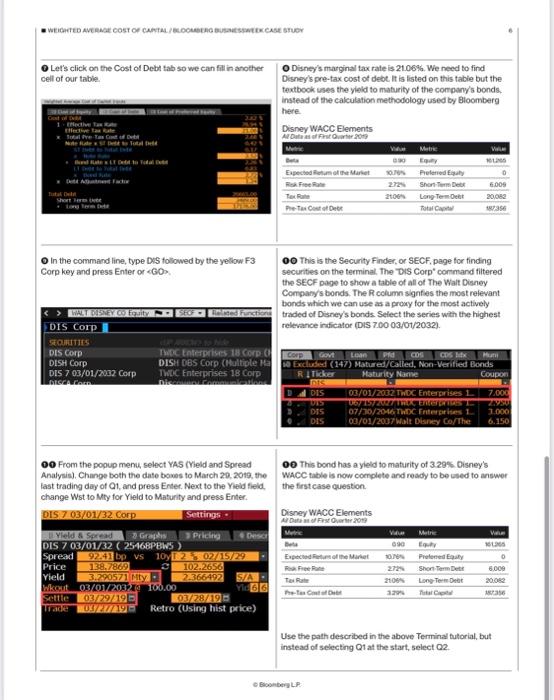
Log in to the Bloomberg Terminal and type DS, press the F8 equity sector key, type WACC into the command line, and then press GO EDIS Equity WACC FUNCTIONS Das Equity WACC DIS Equity FA S Das Equity DON DES Equity EQRP Disney WACC Elements A Data as of First Quarter 2019 From this page we can fill in the capital structure elements of our case's WACC table, including the capital amounts for equity, preferred equity, and debt. Bata Expected Return of the Market Risk Free Rate Tax Rate Pre-Tan Coal of De Rolstol Fyreliams ity Risk Premium Country Prin Expo Pabe Weighted Average Cost of Capital Financial Analysis: Standardized t Dividend Discount Model MACC Equity Risk Premium MACC Hastat Cutialifie Meric Eauty Preferred Equity Short Term Debt Long-Term De TC Value 101205 Notice there are equity elements that may not have been included in the textbook. That's okay. Let's go through this page to fill in the data in our table. 0 6.000 20.062 1873 This is the summary WACC page for Disney. The first thing we need to do is time box the data. Under the Period dropdown menu that says MR, for Most Recent, select Q1 and make the year 2019 Report Cost WXC 10.0% 8. Weighted Average Cost od 01. 2019 Capital Structure (Rillions of USD) Walt Disney Co/The Cost of Capital Clicking on the Equity heading in the Cost of Capital table will bring up the terminal's WACC worksheet for Disney's equity. Equity V DREDE COSE (A-1) 9 Preferred Equity WACC Disney WACC Elements All Oate as of Find Quarter 2019 Beta Expected Retum of the Market Risk Free Rate Pre-Tax Cost of Det Boonberg LP Market Cap ST Debit The beta for Disney's stock is 0.90, the risk free rate is 2.72%, and the expected return of the market is 10.76% This is all the data we need for equity in order to satisfy our simplified WACC formula height Cost WXC 88.68 10.0% 8.8% 2.5% 0.0% 0.0% 090 10.78% 160,950.0 M Equity Preferred Eauty Shon Term De Long-Term De 0.3% 0.0% 9.18 Value 6.009 20082 WEIGHTED AVERAGE COST OF CAPITAL/BLOOMBERG BUSINESSWEEK CASE STUDY Let's click on the Cost of Debt tab so we can fill in another cell of our table. Effective Tax Total fre 1 Total De Short s Bondate In the command line, type DIS followed by the yellow F3 Corp key and press Enter or DIS Corp WALT DISNEY CO Equity SECURITIES DIS Corp DISH Corp DIS 7 03/01/2032 Corp DISCA Con Yhild wkout Settle Trade 00 From the popup menu, select YAS (Yield and Spread Analysis), Change both the date boxes to March 29, 2019, the last trading day of Q1, and press Enter. Next to the Yield field, change Wst to Mty for Yield to Maturity and press Enter. DIS 7 03/01/32 Corp Settings. Pricing Yield & Spread Graphs DIS 7 03/01/32 (25468PBWS Spread 92.41 bp vs 10y 2 02/15/29 Price C 102.2656 2.366492 Descr O Disney's marginal tax rate is 21.06%. We need to find Disney's pre-tax cost of debt. It is listed on this table but the textbook uses the yield to maturity of the company's bonds, instead of the calculation methodology used by Bloomberg here. 138.7869 3.290571 Mty 03/01/2032 100.00 03/29/19 03/28/195 03/27/191 Retro (Using hist price) Disney WACC Elements Al Data as of First Quarter 2019 S/A Yi66 Expected Reum of the Market Risk Free Rate 00 This is the Security Finder, or SECF, page for finding securities on the terminal. The "DIS Corp command filtered the SECF page to show a table of all of The Walt Disney Company's bonds. The R column signfies the most relevant bonds which we can use as a proxy for the most actively Related Functions traded of Disney's bonds. Select the series with the highest relevance indicator (DIS 7.00 03/01/2032). Cost of Deb ROC to Nide TWDC Enterprises 18 Corp (Corp Govt Loan PM COS CDS Mx Muni DISH DBS Corp (Hultiple Hasa Excluded (147) Matured/Called, Non-Verified Bonds TWDC Enterprises 18 Corp Maturity Name Disconry Comm Coupon RI Ticker DIS DIS DIS DIS DIS 090 10.79% 2.72% 2100% Disney WACC Elements Al Data of First Quarter 2019 Metric Equity Preferred Equity Short Term De Long Term Debt Total Capital Expected of the Market Reak Free Re Pre-Tex Cost of Deb Bloomberg LP. 03/01/2032 TWDC Enterprises 1 067 157 2027 TROX Enter 07/30/2046 TWDC Enterprises 1. 03/01/2037Walt Disney Co/The 00 This bond has a yield to maturity of 3.29 % Disney's WACC table is now complete and ready to be used to answer the first case question. V LIN Value Metric 690 0 6.009 20,082 187356 Equity Pretened Equity Short Term Det Long Term Deb 10.76% 272% 2106% 3.29% Total C 7.000 2.990 3.000 6.150 Va 161.265 0 6.000 20.062 Use the path described in the above Terminal tutorial, but instead of selecting Q1 at the start, select Q2. 20 Bloomberg Businessweek Recessions The Year Ahead 2019 An early warning system for downturns may be giving off mixed signals Historically, the $15.4 trillion U.S. Treasury market has offered one of the most reliable barometers for the health of the American econ- omy. Investors are particularly fixated on what's known as the yield curve, which depicts the yields on government debt of different matur- ities at a given point in time. The curve usually slopes upward as investors typically demand higher returns for locking up their money for a longer period. Occasionally, the curve flips, with yields on short-term debt exceeding those on longer bonds. That's nor- mally a sign investors believe economic growth will slow and interest rates will eventually fall. Research by the Federal Reserve Bank of San Francisco has shown that an inversion has pre- ceded every U.S. recession for the past 60 years. The U.S. economy is 37 quarters into what may prove to be its longest expansion on record. Analysts surveyed by Bloomberg expect gross domestic product growth to come in at 2.9 per cent this year, up from 2.2 percent last year. Wages are rising as unfilled vacancies hover near all-time highs. But there are reasons to wonder whether the curve's predictive powers remain intact. In the wake of the financial crisis, the Federal Reserve not only slashed interest rates, it also bought tril- lions of dollars in long-term government bonds. At one point in 2017, the purchases pushed down the term premium-the extra bonus investors usually get to hold longer-term debt-on 10-year Treasury notes by a full percentage point, according to one study. replacing them until October 2017, and that process is ongoing. The Fed projects three possible rate hikes in 2019. That on its own could be enough to erase much of the gap between short-term rates and longer term ones. And if the Fed steps up the pace of hikes, we could more easily see an inversion. A pair of researchers at the Brookings Institution in Washington caution that inversion may not necessarily be the harbinger of a down- turn this time. In an April web post, Michael Ng and David Wessel wrote that the lingering effects of the Fed's extraordinary bond-buying pro- gram could be distorting the curve by weighing down on the term premium. That means "that U.S. Treasury Yield Curve Nov 13, 2010 Nov 13, 2018 With times this good, the biggest betting game on Wall Street is when they'll go bad. Barclays Plc, Goldman Sachs Group Inc., and other banks are predicting inversion will happen sometime in 2019. The conventional wisdom: Afterward-year 5-year it's only a matter of time anywhere from 6 to 24 months before a recession starts. z 10-year relatively small increases in short-term inter- est rates relative to long-term rates could lead to inversion." In an Oct. 29 note to clients, Scott Minerd, global chief investment officer at Guggenheim Partners, said that argument is flawed. It fails to recognize that factors such as regulatory changes, including those to money-market mutual funds, and an increase in Treasury issuance have acted in the opposite direction, putting upward pres sure on long-term rates. The yield curve, Minerd said, remains as reliable an indicator as ever. O While the Fed began raising short-term inter- est rates in December 2015, it didn't start letting the bonds on its balance sheet mature without-Liz Capo McCormick and Jeanna Smialek Global Economics 30-year 1 0 WACC Comparisons Target Disney Parks and Resorts Six Flags Cedar Fair Studio Entertainment Lions Gate Broadcasting and Media Viacom Netflix Consumer Products ULTA Sally Beauty Game Stop WACC Sensitivity Beta 0.96 0.89 0.77 1.21 1.1 1.46 0.86 0.81 0.92 Source: Bloomberg All Data Effective 31 July 2019 Cost of Capital Components Risk Free Rate Tax Rate Expected Return of Market 9.6% 9.6% 9.6% 9.6% 0.0% 9.6% Weighted Average Cost of Capital Case Calculations 9.6% 9.6% 9.6% 24% 2.4% 24.2% 2.4% 17.0% 2.4% 21.8% 2.4% 2.4% 24% 0.0% 2.4% 22.0% 2.4% 17.7% 22.7% 25.7% 23.5% Pre-Tax Debt Cost Bond Rating 3.0% A 4.2% B+ 4.8% B+ 4.3% B 4.5% 686. 2.6% 08- 2.5% 6.9% 88 5.9% 88- Capital Structure Components Short-Term Long-Term Debt Debt Equity 248.699 4,190 2.699 2.666 12.050 160.826 20.034 1,600 918 21,923 18.5 7.5 439 36.311 211 21 250 2,467 2,150 2.838 320 8,638 138 13,541 1,654 1,560 1,022 Total Capital 306,933 6,675.5 4,856.5 5,043 21,017 174,505 21,899 3,184 2.190 WACC Target Disney Six Flags Fed Rate Move Disney Six Flags Credit Rating Change Disney Six Flags Bear Stock Market Disney Six Flags Beta Tax Rate Increases Disney Six Flags 0.96 0.89 0.96 0.89 0.96 0.89 Additional Debt for Fox Acquisition Disney 0.96 Six Flags 0.89 0.96 0.89 0.96 0.89 Expected Return of Market Cost of Capital Components Tax Rate 9.6% 9.6% 9.6% 9.6% 9.6% 9.6% 9.6% 9.6% 9.6% 9.6% Weighted Average Cost of Capital Scenario Changes 9.6% 9.6% Risk Free Rate 2.4% 2.4% 2.4% 21.8% 2.4% 24.2% 2.4% 2.4% 21,8% 24.2% 21.8% 24.2% 2.4% 21.8% 2.4% 24.2% 2.4% 2.4% 2.4% 21.8% 2.4% 24.2% 21.8% 24.2% Pre-Tax Debt Cost 3.0% 4.2% Bond Rating A B+ 3.0% A 4.2% B+ 3.0% A 4.2% B+ 3.0% A 4.2% B+ 3.0% A 4.2% B+ 3.0% A 4.2% B+ Capital Structure Components Short-Term Long-Term Total Capital Debl Debt Equity 248,699 4,190 248,699 4,190 248,699 4,190 248,699 4,190 248,699 4,190 248,699 4,190 21.923 18.5 21,923 18.5 21,923 18.5 21,923 18.5 21.923 18.5 21,923 18.5 36.311 306.933 2,467 6.675.5 36.311 306,933 2,467 6,675.5 36,311 2,467 306,933 6.675.5 36.311 306,933 2,467 6.675.5 36.311 306.933 2,467 6.675.5 36,311 306.933 2,467 6.675.5 WACC 7.9% 6.3% 7.9% 6.3% 7.9% 6.3% 7.9% 6.3% 7.9% 6.3% 7.9% 6.3% CASE Bloomberg Businessweek STUDIES 21 III Weighted Average Cost of Capital impacted by changing variables in the weighted average cost of Analyze how the theoretical concepts This lesson explores how several companies and industries are of weighted average cost of capital (WACC) connect to the real world by exploring the impact of changing WACC variables on a company. capital (WACC) formula. To apply WACC learning to real work complexities, we will examine how Boeing is impacted by inter est rates in class and then apply the same lessons to Disney for homework WEIGHTED AVERAGE COST OF CAPITAL/BLOOMBERG BUSINESSWEEK CASE STUDY Case Study Notes Companies within the same sector typically share similar capital | RISK FREE RATE structures and costs of capital. For example, most power utili ties are engaged in fundamentally the same business; genera- tion, transmitting, and distributing electric power. The utility business is highly dependent upon expensive fixed-asset invest ments 6.e., power plants) which are often financed with debt. Consequently, analysts expect companies within the same see tor or industry to have similar betas, capital structures, bond ratings, and WACCS. Disney is a diversified entertainment company. Its diversi fication exists because its revenues come from four different, but related, business segments-parks and resorts, studio enter tainment, broadcasting and media, and consumer products. Since there is no other enterprise quite like Disney, we exam. ine the WACCs of companies that operate within one or more of its segments. Beta The beta of a stock is a representation of how the stock moves with the broader equity market. Disney has a beta of 0.96 which implies that when the broad equity market goes up or down by one percent, Disney's stock will rise or fall by 0.96 percent. Low beta stocks, between 0.5 and 0.8, tend to be defensive. They do not rise much when the market rises, but they also do not fall significantly when the market falls. Disney's beta indi cates a closer relationship to the market than any of its peers used in this case. Betas of Companies Comparable to Disney Segments A Data as of July 31 2010 140 140 120 0:30 0:40 0:40 0:20 000 0:00 0.89 6.77 LIG 1:40 epis 0.00 081 EXPECTED RETURN OF THE MARKET The expected return of the market is a fairly general observa- tion. In reality, no one knows by what degree the stock mar- ket will rise or fall over the next year. Nevertheless, in order to assess an individual stock we must have a view on where the broader market is heading. The expected return of the market is the same for every stock. The risk free rate is the U.S. government bond. A U.S. bond's yield is considered risk free because the U.S. has not and is not expected to default. TAX RATE The company's tax rate impacts the after tax cost of debt bur has no bearing on either the cost of preferred equity or com- mon equity. The higher a company's tax rate the lower the after tax cost of debt. Consequently, as a source of capital, debt is a tax shield. PRE-TAX COST OF DEBT The pre-tax cost of debt can be determined by calculating the yield to maturity on the company's bonds. A bond's yield to maturity can be influenced by many factors including inflation, credit quality, macroeconomic fundamentals, and how the com pany's bonds are structured. Bloomberg LP WEIGHTED AVERAGE COST OF CAPITAL/BLOOMBERG BUSINESSWEEK CASE STUDY Case Questions Use the Terminal Tutorial to calculate Disney's weighted average cost of capital (WACC) for Q1 2019. Bloomberg includes more elements in the WACC calculation than the textbook does. For our purposes, use the textbook formula with the data points from Bloomberg. Use the Bloomberg Terminal to gather the necessary data to make a similar calculation for Q2 2019. Using the Case Study Notes and the accompanying spreadsheet, calculate the WACC of each Disney segment comparable. Describe the primary WACC drivers that explain the differences between the WACC of Disney and its comparables. Bloomberg LP WEIGHTED AVERAGE COST OF CAPITAL/BLOOMBERG BUSINESSWEEK CASE STUDY In the WACC Sensitivity tab on the accompanying spreadsheet, alter the cells as described below to see how changes to WACC's inputs impact the WACC. Write a few sentences describing each change. OFED RATE INCREASE An increase of the Federal Reserve interest rate by 200 basis points (2.0%) lifts the borrowing costs of every debt issuer. What is Disney's adjusted WACC? O CREDIT RATING CHANGE A downgrade in Disney's credit rating should increase its cost of debt to the same level as Six Flags, all other conditions being equal. What is Disney's adjusted WACC? ODEBT FOR ACQUISITION In 2018, Disney announced it would acquire Twenty-First Centry Fox assests for $71.3 billion. Assume Disney paid for the acqui sition in cash by raising additional debt. What is Disney's adjusted WACC? OUS. EQUITY MARKET DOWNTURN Equity market expectations may cool resulting in an expectation that equity markets may only expand by 200 basis points (2.0%) over the coming year. What is Disney's adjusted WACC? O INCREASED MARGINAL TAX RATE The tax rate cut has ended. A new administration is in power. Assume Disney's marginal tax rate rises to 30.0%. What is Disney's adjusted WACC? Bonberg LP WEIGHTED AVERAGE COST OF CARTAL/BLOOMBERG BUSINESSWEEK CASE STUDY Terminal Tutorial Use the Bloomberg Terminal to answer case questions 1&2 Use these directions as a guide or watch the accompanying video tutorial. Web: https://vimeo.com/470303565 Terminal: PLYR VOD 332919204 Log in to the Bloomberg Terminal and type DS, press the F8 equity sector key, type WACC into the command line, and then press GO EDIS Equity WACC FUNCTIONS Das Equity WACC DIS Equity FA S Das Equity DON DES Equity EQRP Disney WACC Elements A Data as of First Quarter 2019 From this page we can fill in the capital structure elements of our case's WACC table, including the capital amounts for equity, preferred equity, and debt. Bata Expected Return of the Market Risk Free Rate Tax Rate Pre-Tan Coal of De Rolstol Fyreliams ity Risk Premium Country Prin Expo Pabe Weighted Average Cost of Capital Financial Analysis: Standardized t Dividend Discount Model MACC Equity Risk Premium MACC Hastat Cutialifie Meric Eauty Preferred Equity Short Term Debt Long-Term De TC Value 101205 Notice there are equity elements that may not have been included in the textbook. That's okay. Let's go through this page to fill in the data in our table. 0 6.000 20.062 1873 This is the summary WACC page for Disney. The first thing we need to do is time box the data. Under the Period dropdown menu that says MR, for Most Recent, select Q1 and make the year 2019 Report Cost WXC 10.0% 8. Weighted Average Cost od 01. 2019 Capital Structure (Rillions of USD) Walt Disney Co/The Cost of Capital Clicking on the Equity heading in the Cost of Capital table will bring up the terminal's WACC worksheet for Disney's equity. Equity V DREDE COSE (A-1) 9 Preferred Equity WACC Disney WACC Elements All Oate as of Find Quarter 2019 Beta Expected Retum of the Market Risk Free Rate Pre-Tax Cost of Det Boonberg LP Market Cap ST Debit The beta for Disney's stock is 0.90, the risk free rate is 2.72%, and the expected return of the market is 10.76% This is all the data we need for equity in order to satisfy our simplified WACC formula height Cost WXC 88.68 10.0% 8.8% 2.5% 0.0% 0.0% 090 10.78% 160,950.0 M Equity Preferred Eauty Shon Term De Long-Term De 0.3% 0.0% 9.18 Value 6.009 20082 WEIGHTED AVERAGE COST OF CAPITAL/BLOOMBERG BUSINESSWEEK CASE STUDY Let's click on the Cost of Debt tab so we can fill in another cell of our table. Effective Tax Total fre 1 Total De Short s Bondate In the command line, type DIS followed by the yellow F3 Corp key and press Enter or DIS Corp WALT DISNEY CO Equity SECURITIES DIS Corp DISH Corp DIS 7 03/01/2032 Corp DISCA Con Yhild wkout Settle Trade 00 From the popup menu, select YAS (Yield and Spread Analysis), Change both the date boxes to March 29, 2019, the last trading day of Q1, and press Enter. Next to the Yield field, change Wst to Mty for Yield to Maturity and press Enter. DIS 7 03/01/32 Corp Settings. Pricing Yield & Spread Graphs DIS 7 03/01/32 (25468PBWS Spread 92.41 bp vs 10y 2 02/15/29 Price C 102.2656 2.366492 Descr O Disney's marginal tax rate is 21.06%. We need to find Disney's pre-tax cost of debt. It is listed on this table but the textbook uses the yield to maturity of the company's bonds, instead of the calculation methodology used by Bloomberg here. 138.7869 3.290571 Mty 03/01/2032 100.00 03/29/19 03/28/195 03/27/191 Retro (Using hist price) Disney WACC Elements Al Data as of First Quarter 2019 S/A Yi66 Expected Reum of the Market Risk Free Rate 00 This is the Security Finder, or SECF, page for finding securities on the terminal. The "DIS Corp command filtered the SECF page to show a table of all of The Walt Disney Company's bonds. The R column signfies the most relevant bonds which we can use as a proxy for the most actively Related Functions traded of Disney's bonds. Select the series with the highest relevance indicator (DIS 7.00 03/01/2032). Cost of Deb ROC to Nide TWDC Enterprises 18 Corp (Corp Govt Loan PM COS CDS Mx Muni DISH DBS Corp (Hultiple Hasa Excluded (147) Matured/Called, Non-Verified Bonds TWDC Enterprises 18 Corp Maturity Name Disconry Comm Coupon RI Ticker DIS DIS DIS DIS DIS 090 10.79% 2.72% 2100% Disney WACC Elements Al Data of First Quarter 2019 Metric Equity Preferred Equity Short Term De Long Term Debt Total Capital Expected of the Market Reak Free Re Pre-Tex Cost of Deb Bloomberg LP. 03/01/2032 TWDC Enterprises 1 067 157 2027 TROX Enter 07/30/2046 TWDC Enterprises 1. 03/01/2037Walt Disney Co/The 00 This bond has a yield to maturity of 3.29 % Disney's WACC table is now complete and ready to be used to answer the first case question. V LIN Value Metric 690 0 6.009 20,082 187356 Equity Pretened Equity Short Term Det Long Term Deb 10.76% 272% 2106% 3.29% Total C 7.000 2.990 3.000 6.150 Va 161.265 0 6.000 20.062 Use the path described in the above Terminal tutorial, but instead of selecting Q1 at the start, select Q2
