 Ans
Ans
Questions above
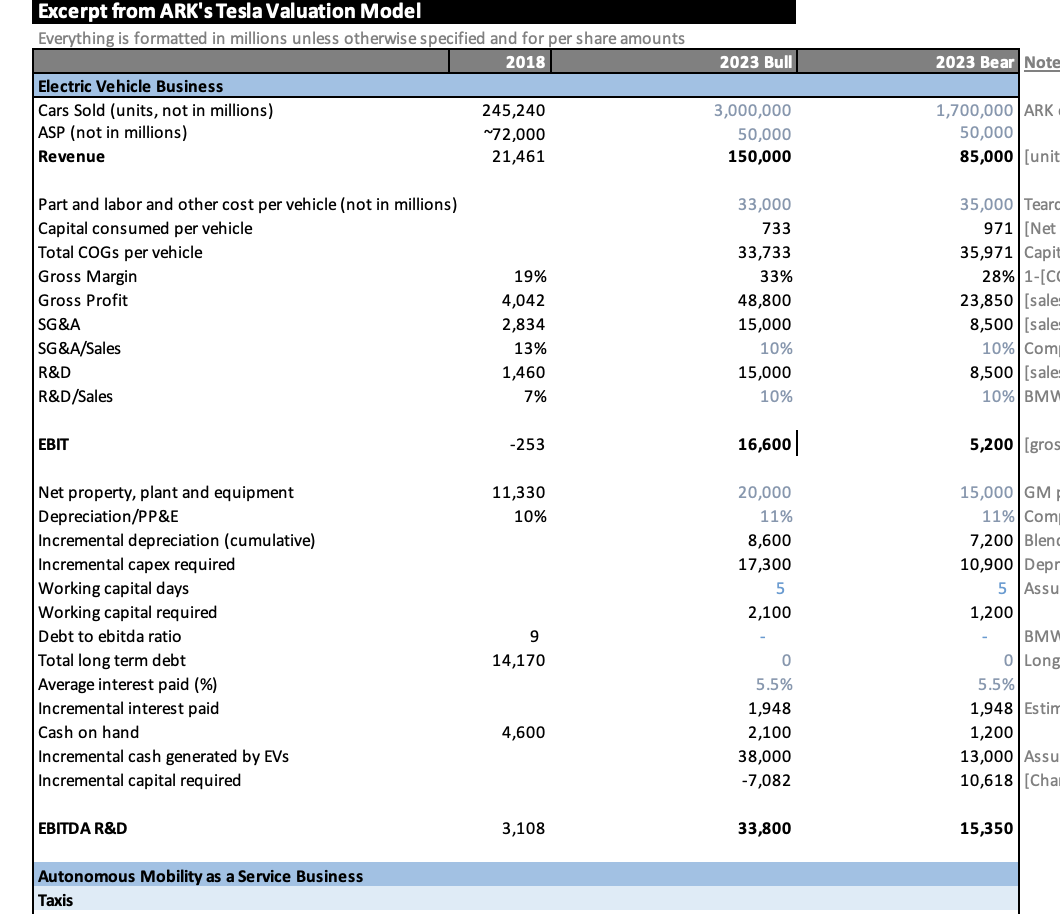
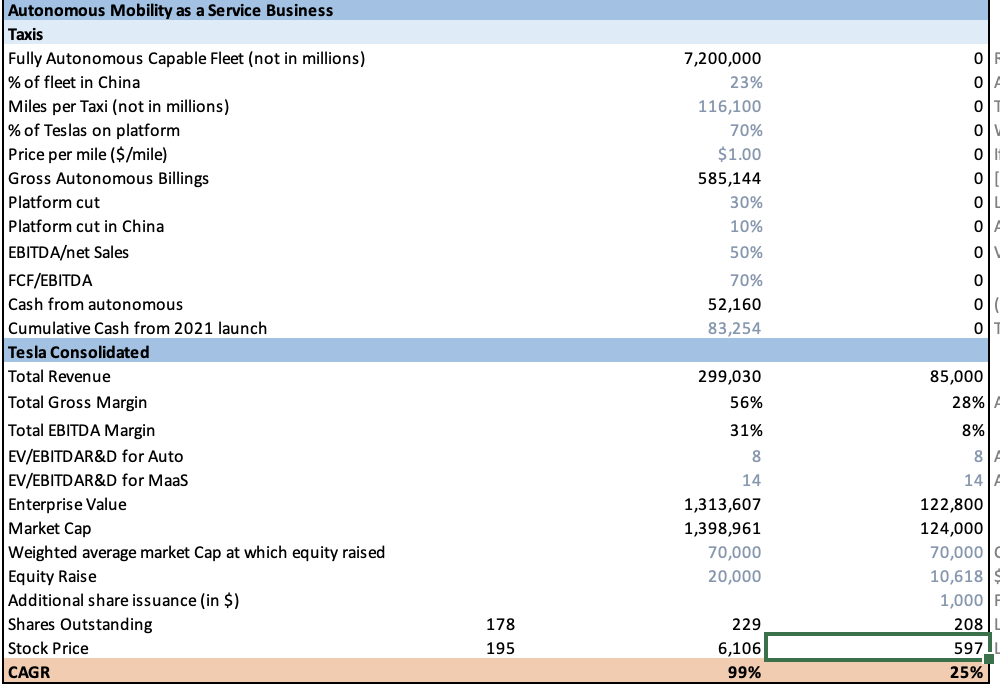
1 1 Q9a Q9b Q9C Q9d Q9e View this Tesla valuation report by Tash Keeney from ARK Invest, dated May 22nd 2019. The spreadsheet model named 'Tesla Vluation for Github_5.27.19_v3.5.xlsx' is copied in this workbook in the sheet 'Tesla Model' for you to see. The below questions are based on this model. https://ark-invest.com/articles/analyst-esearch/tesla-valuation-model/ Does ARK value Tesla using DCF or multoles? Write 'DCF' or 'multiples'. Do they value Tesla as a single uniform ntity or by summing valuations of multiple divisions? Write 'single' or 'sum'. What assumptions are made about Tesi's interest-bearing leverage in 2023? Write 'levered' or 'unlevered'. Does the valuation model include the beefit of interest tax shields? Write 'includes' or 'excludes'. Based on the current Tesla share price $1,025.49, is this better than the bull scenario, worse than the bear scenario or in between? Write 'better', 'worse' or 'between'. With regards to the above question, keo in mind that there was a stock split in 2020 that you should adjust for. Ignore timing differences between now and 2023 and simply compare stock prices, adjusted for the stock split. Are the stock prices on line 68 of the Tela vauation model present values as at 2018 or future values as at 2023? Write '2018' or '2023'. 1 1 2 Q9f 2 2023 Bull 2023 Bear Note Excerpt from ARK's Tesla Valuation Model Everything is formatted in millions unless otherwise specified and for per share amounts 2018 Electric Vehicle Business Cars Sold (units, not in millions) 245,240 ASP (not in millions) 72,000 Revenue 21,461 3,000,000 50,000 150,000 1,700,000 ARK 50,000 85,000 [unit Part and labor and other cost per vehicle (not in millions) Capital consumed per vehicle Total COGs per vehicle Gross Margin Gross Profit SG&A SG&A/Sales R&D R&D/Sales 19% 4,042 2,834 13% 1,460 7% 33,000 733 33,733 33% 48,800 15,000 10% 15,000 10% 35,000 Tearc 971 [Net 35,971 Capit 28% 1-[CO 23,850(sale: 8,500 (sale: 10% Com 8,500 (sale 10% BMV EBIT -253 16,600 5,200 [gros 11,330 10% 20,000 11% 8,600 17,300 5 2,100 Net property, plant and equipment Depreciation/PP&E Incremental depreciation (cumulative) Incremental capex required Working capital days Working capital required Debt to ebitda ratio Total long term debt Average interest paid (%) Incremental interest paid Cash on hand Incremental cash generated by EVS Incremental capital required 9 15,000 GM 11% Com 7,200 Blend 10,900 Depr 5 Assu 1,200 BMW O Long 5.5% 1,948 Estim 1,200 13,000 Assu 10,618 [Cha 14,170 0 5.5% 1,948 2,100 38,000 -7,082 4,600 EBITDA R&D 3,108 33,800 15,350 Autonomous Mobility as a Service Business Taxis 0 0 0 0 7,200,000 23% 116,100 70% $1.00 585,144 30% 10% 50% 0 0 0 0 0 70% 52,160 83,254 0 0 0 Autonomous Mobility as a Service Business Taxis Fully Autonomous Capable Fleet (not in millions) % of fleet in China Miles per Taxi (not in millions) % of Teslas on platform Price per mile ($/mile) Gross Autonomous Billings Platform cut Platform cut in China EBITDAet Sales FCF/EBITDA Cash from autonomous Cumulative Cash from 2021 launch Tesla Consolidated Total Revenue Total Gross Margin Total EBITDA Margin EV/EBITDAR&D for Auto EV/EBITDAR&D for Maas Enterprise Value Market Cap Weighted average market Cap at which equity raised Equity Raise Additional share issuance (in $) Shares Outstanding Stock Price CAGR 299,030 56% 85,000 28% 31% 8% 8 8 14 1,313,607 1,398,961 70,000 20,000 14 122,800 124,000 70,000 10,6181 1,000 208 178 195 229 6,106 99% 597 25% 1 1 Q9a Q9b Q9C Q9d Q9e View this Tesla valuation report by Tash Keeney from ARK Invest, dated May 22nd 2019. The spreadsheet model named 'Tesla Vluation for Github_5.27.19_v3.5.xlsx' is copied in this workbook in the sheet 'Tesla Model' for you to see. The below questions are based on this model. https://ark-invest.com/articles/analyst-esearch/tesla-valuation-model/ Does ARK value Tesla using DCF or multoles? Write 'DCF' or 'multiples'. Do they value Tesla as a single uniform ntity or by summing valuations of multiple divisions? Write 'single' or 'sum'. What assumptions are made about Tesi's interest-bearing leverage in 2023? Write 'levered' or 'unlevered'. Does the valuation model include the beefit of interest tax shields? Write 'includes' or 'excludes'. Based on the current Tesla share price $1,025.49, is this better than the bull scenario, worse than the bear scenario or in between? Write 'better', 'worse' or 'between'. With regards to the above question, keo in mind that there was a stock split in 2020 that you should adjust for. Ignore timing differences between now and 2023 and simply compare stock prices, adjusted for the stock split. Are the stock prices on line 68 of the Tela vauation model present values as at 2018 or future values as at 2023? Write '2018' or '2023'. 1 1 2 Q9f 2 2023 Bull 2023 Bear Note Excerpt from ARK's Tesla Valuation Model Everything is formatted in millions unless otherwise specified and for per share amounts 2018 Electric Vehicle Business Cars Sold (units, not in millions) 245,240 ASP (not in millions) 72,000 Revenue 21,461 3,000,000 50,000 150,000 1,700,000 ARK 50,000 85,000 [unit Part and labor and other cost per vehicle (not in millions) Capital consumed per vehicle Total COGs per vehicle Gross Margin Gross Profit SG&A SG&A/Sales R&D R&D/Sales 19% 4,042 2,834 13% 1,460 7% 33,000 733 33,733 33% 48,800 15,000 10% 15,000 10% 35,000 Tearc 971 [Net 35,971 Capit 28% 1-[CO 23,850(sale: 8,500 (sale: 10% Com 8,500 (sale 10% BMV EBIT -253 16,600 5,200 [gros 11,330 10% 20,000 11% 8,600 17,300 5 2,100 Net property, plant and equipment Depreciation/PP&E Incremental depreciation (cumulative) Incremental capex required Working capital days Working capital required Debt to ebitda ratio Total long term debt Average interest paid (%) Incremental interest paid Cash on hand Incremental cash generated by EVS Incremental capital required 9 15,000 GM 11% Com 7,200 Blend 10,900 Depr 5 Assu 1,200 BMW O Long 5.5% 1,948 Estim 1,200 13,000 Assu 10,618 [Cha 14,170 0 5.5% 1,948 2,100 38,000 -7,082 4,600 EBITDA R&D 3,108 33,800 15,350 Autonomous Mobility as a Service Business Taxis 0 0 0 0 7,200,000 23% 116,100 70% $1.00 585,144 30% 10% 50% 0 0 0 0 0 70% 52,160 83,254 0 0 0 Autonomous Mobility as a Service Business Taxis Fully Autonomous Capable Fleet (not in millions) % of fleet in China Miles per Taxi (not in millions) % of Teslas on platform Price per mile ($/mile) Gross Autonomous Billings Platform cut Platform cut in China EBITDAet Sales FCF/EBITDA Cash from autonomous Cumulative Cash from 2021 launch Tesla Consolidated Total Revenue Total Gross Margin Total EBITDA Margin EV/EBITDAR&D for Auto EV/EBITDAR&D for Maas Enterprise Value Market Cap Weighted average market Cap at which equity raised Equity Raise Additional share issuance (in $) Shares Outstanding Stock Price CAGR 299,030 56% 85,000 28% 31% 8% 8 8 14 1,313,607 1,398,961 70,000 20,000 14 122,800 124,000 70,000 10,6181 1,000 208 178 195 229 6,106 99% 597 25%

 Ans
Ans


