Answered step by step
Verified Expert Solution
Question
1 Approved Answer
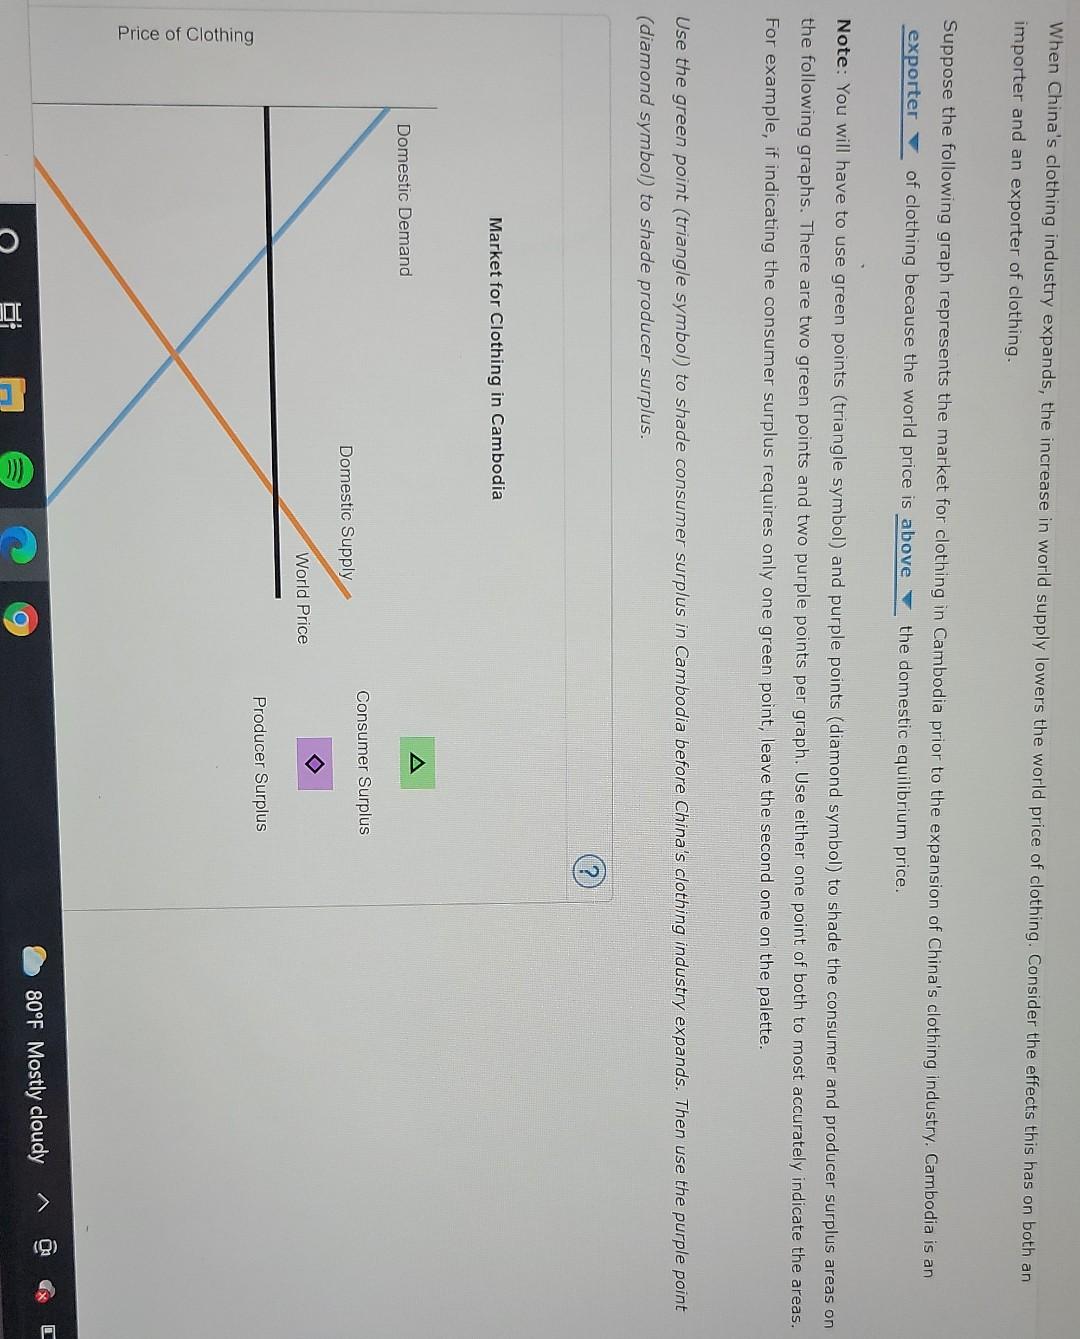
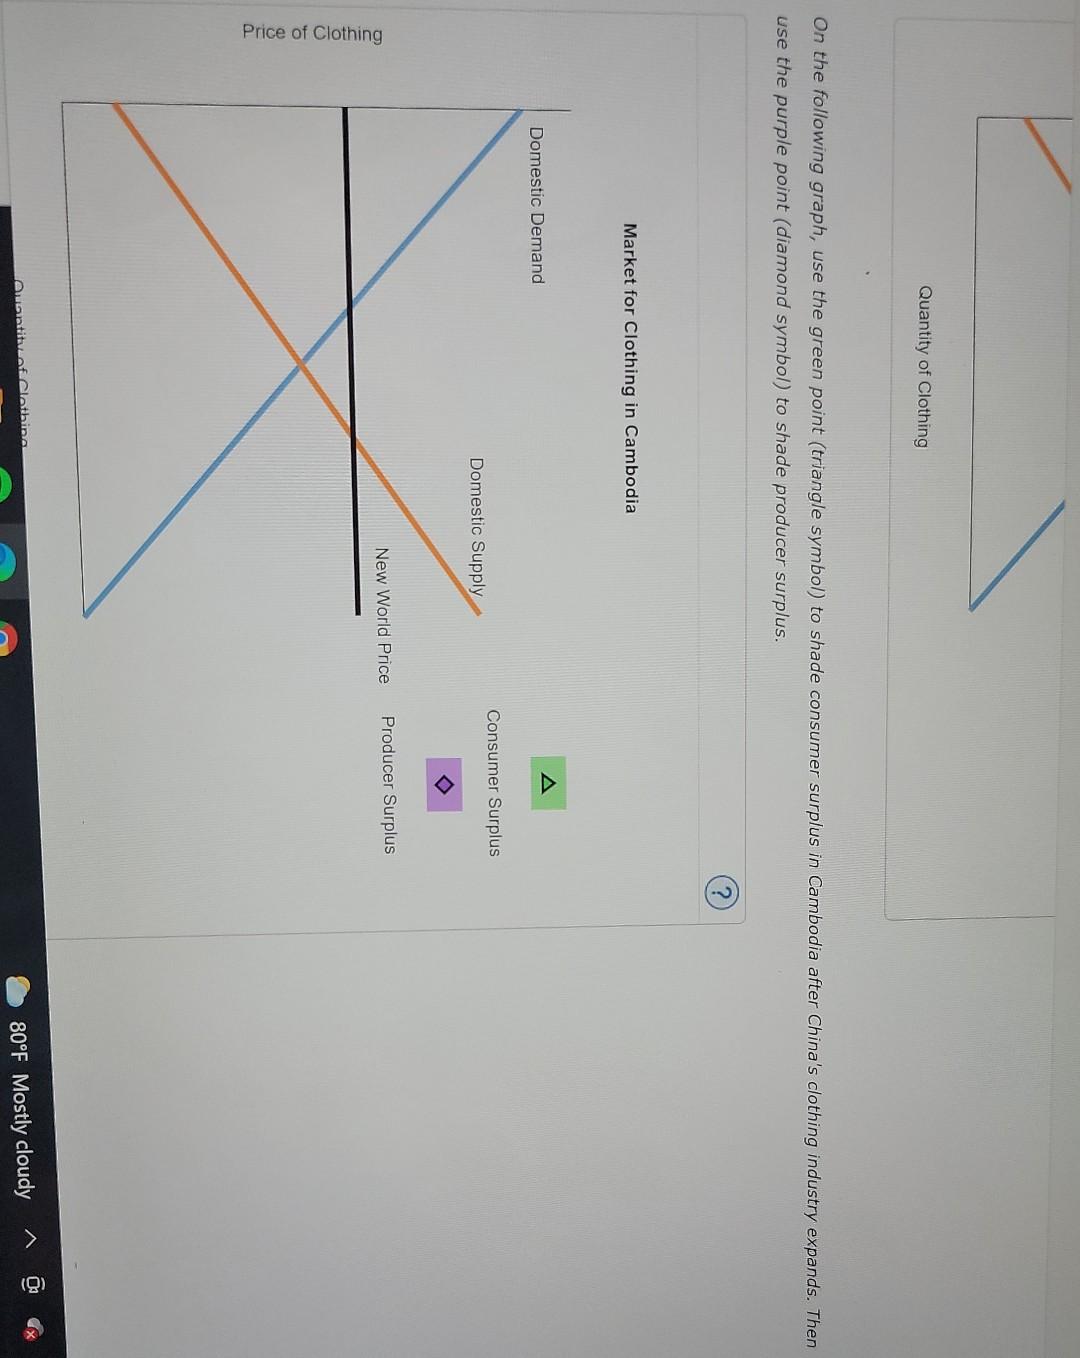
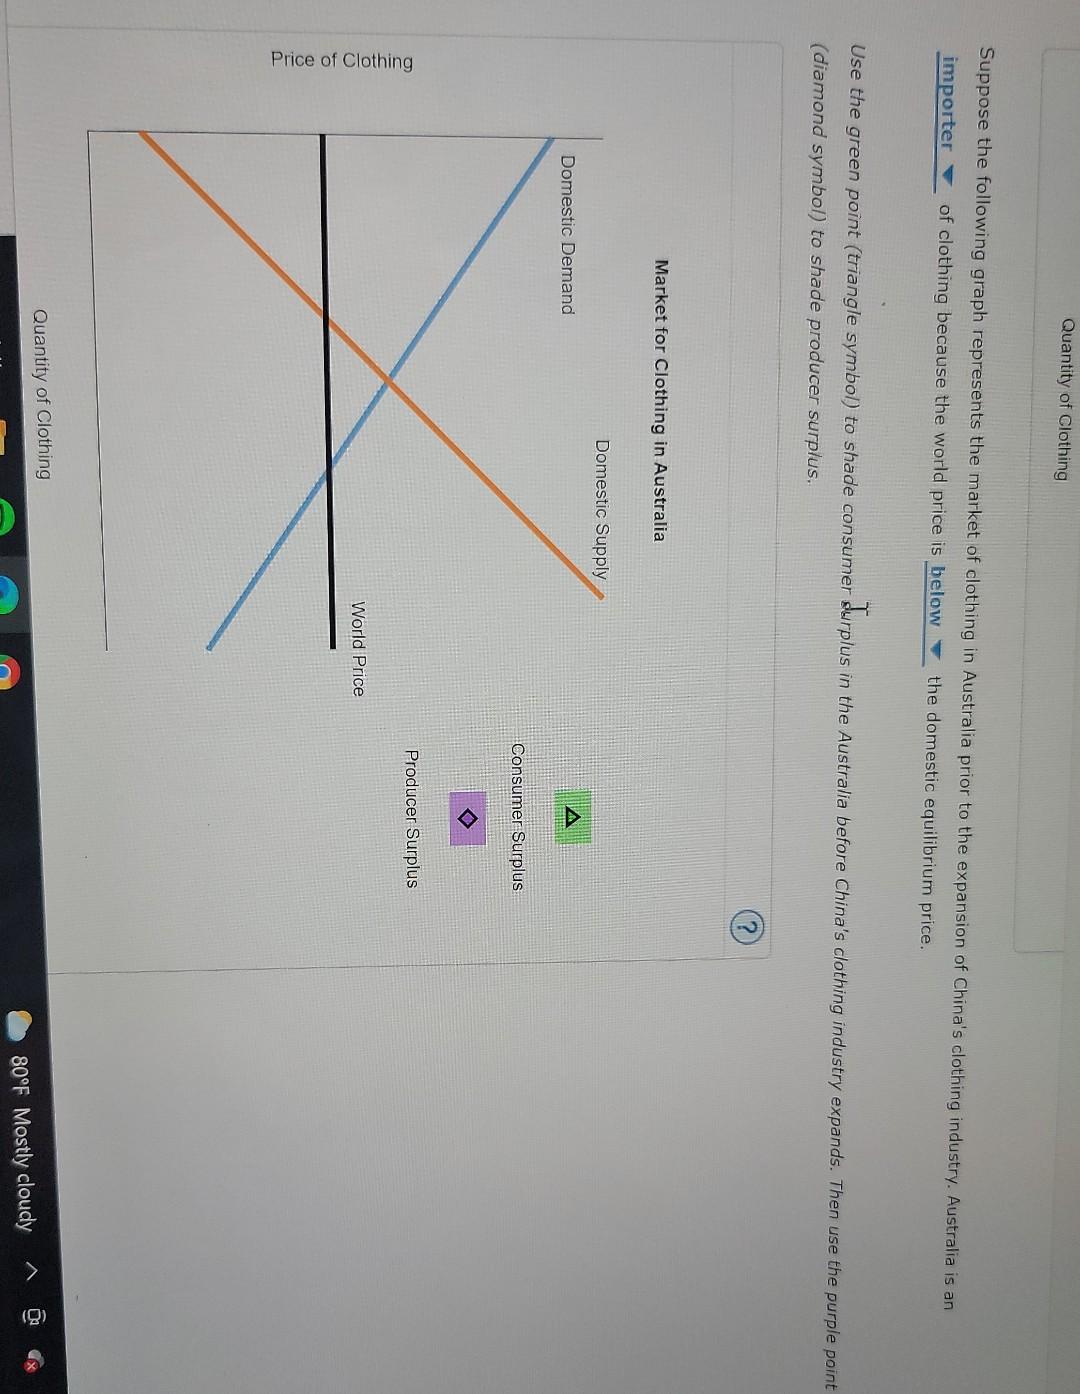
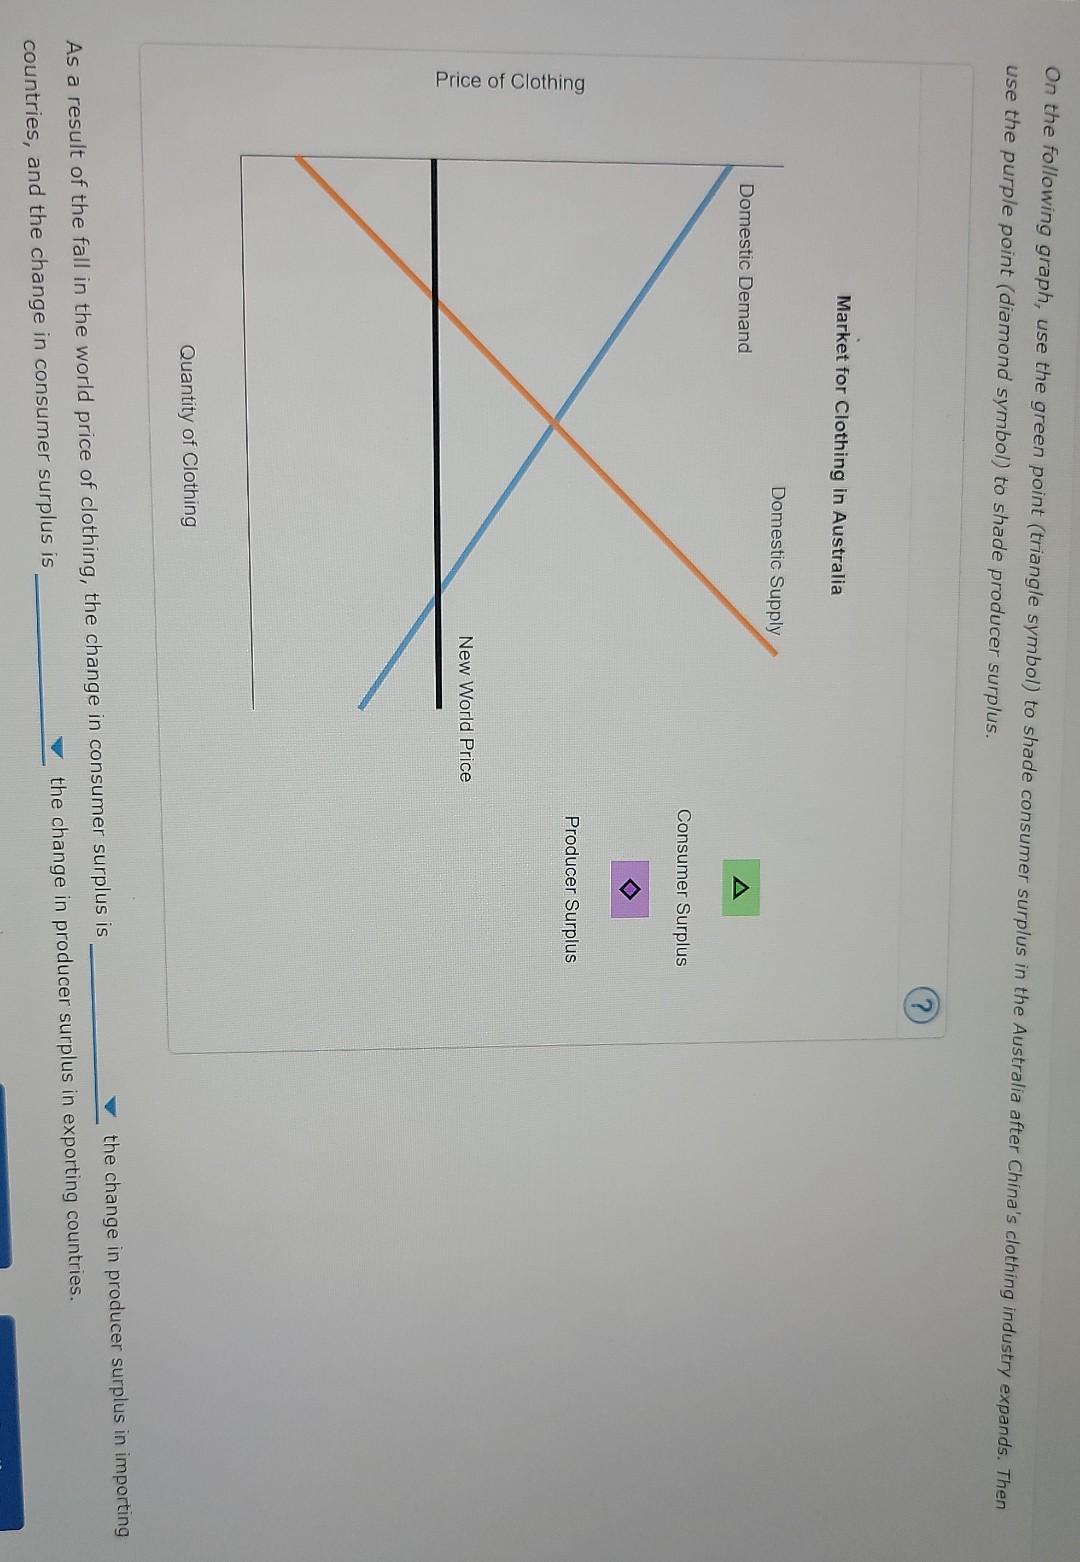
answer all blanks please help with coloring chart spots correctly When China's clothing industry expands, the increase in world supply lowers the world price of
answer all blanks
please help with coloring chart spots correctly
When China's clothing industry expands, the increase in world supply lowers the world price of clothing. Consider the effects this has on both an importer and an exporter of clothing. Suppose the following graph represents the market for clothing in Cambodia prior to the expansion of China's clothing industry. Cambodia is an exporter of clothing because the world price is above the domestic equilibrium price. Note: You will have to use green points (triangle symbol) and purple points (diamond symbol) to shade the consumer and producer surplus areas on the following graphs. There are two green points and two purple points per graph. Use either one point of both to most accurately indicate the areas. For example, if indicating the consumer surplus requires only one green point, leave the second one on the palette. Use the green point (triangle symbol) to shade consumer surplus in Cambodia before China's clothing industry expands. Then use the purple point (diamond symbol) to shade producer surplus. Market for Clothing in Cambodia A Domestic Demand Consumer Surplus Domestic Supply World Price Producer Surplus Price of Clothing A CX 6 80F Mostly cloudy O C Quantity of Clothing On the following graph, use the green point (triangle symbol) to shade consumer surplus in Cambodia after China's clothing industry expands. Then use the purple point (diamond symbol) to shade producer surplus. Market for Clothing in Cambodia A Domestic Demand Consumer Surplus Domestic Supply New World Price Producer Surplus Price of Clothing (Q) (0) antitat Clothina 80F Mostly cloudy Quantity of Clothing Suppose the following graph represents the market of clothing in Australia prior to the expansion of China's clothing industry. Australia is an importer of clothing because the world price is below the domestic equilibrium price. Use the green point (triangle symbol) to shade consumer surplus in the Australia before China's clothing industry expands. Then use the purple point (diamond symbol) to shade producer surplus. Market for Clothing in Australia Domestic Supply Domestic Demand Consumer Surplus Producer Surplus World Price Price of Clothing Quantity of Clothing 80F Mostly cloudy On the following graph, use the green point (triangle symbol) to shade consumer surplus in the Australia after China's clothing industry expands. Then use the purple point (diamond symbol) to shade producer surplus. Market for Clothing in Australia Domestic Supply Domestic Demand Consumer Surplus Producer Surplus Price of Clothing New World Price Quantity of Clothing As a result of the fall in the world price of clothing, the change in consumer surplus is the change in producer surplus in importing countries, and the change in consumer surplus is the change in producer surplus in exporting countriesStep by Step Solution
There are 3 Steps involved in it
Step: 1

Get Instant Access to Expert-Tailored Solutions
See step-by-step solutions with expert insights and AI powered tools for academic success
Step: 2

Step: 3

Ace Your Homework with AI
Get the answers you need in no time with our AI-driven, step-by-step assistance
Get Started


