Answer all.... Part III. Solow Model of Growth Suppose that the production function is given by Y=0.5 VK VN. Assume that the size of the
Answer all....
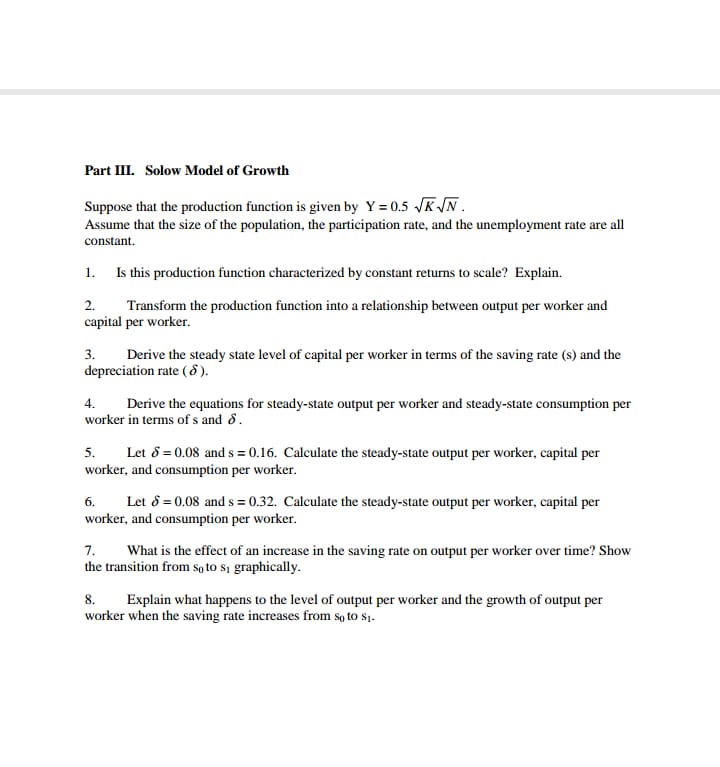
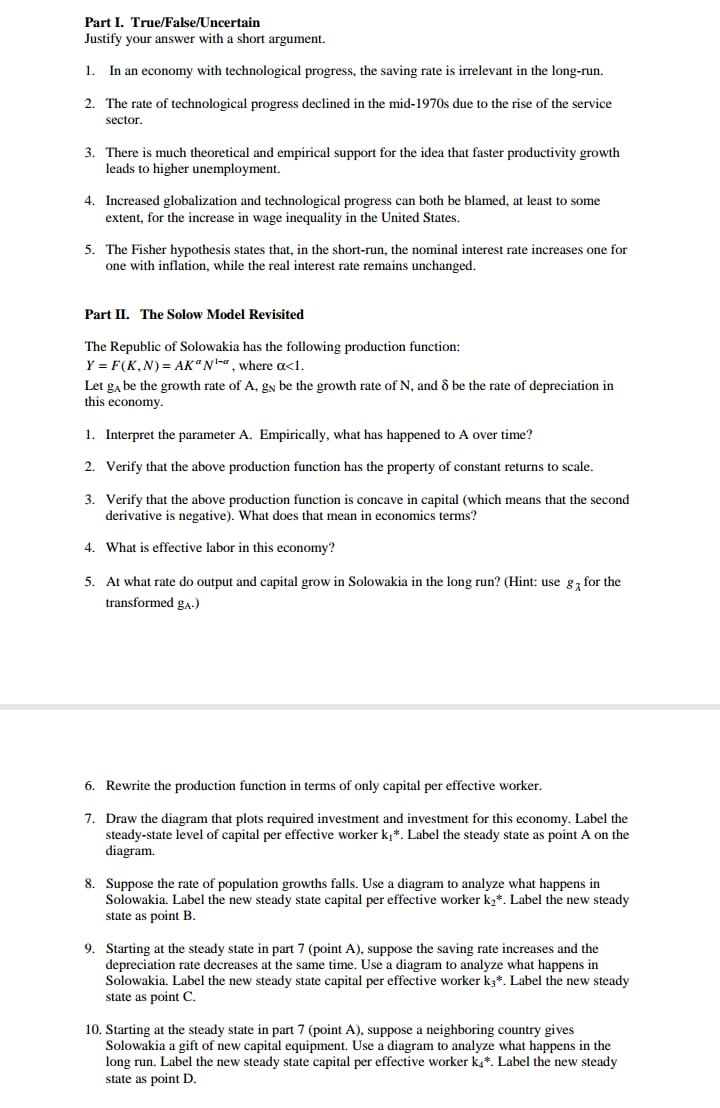
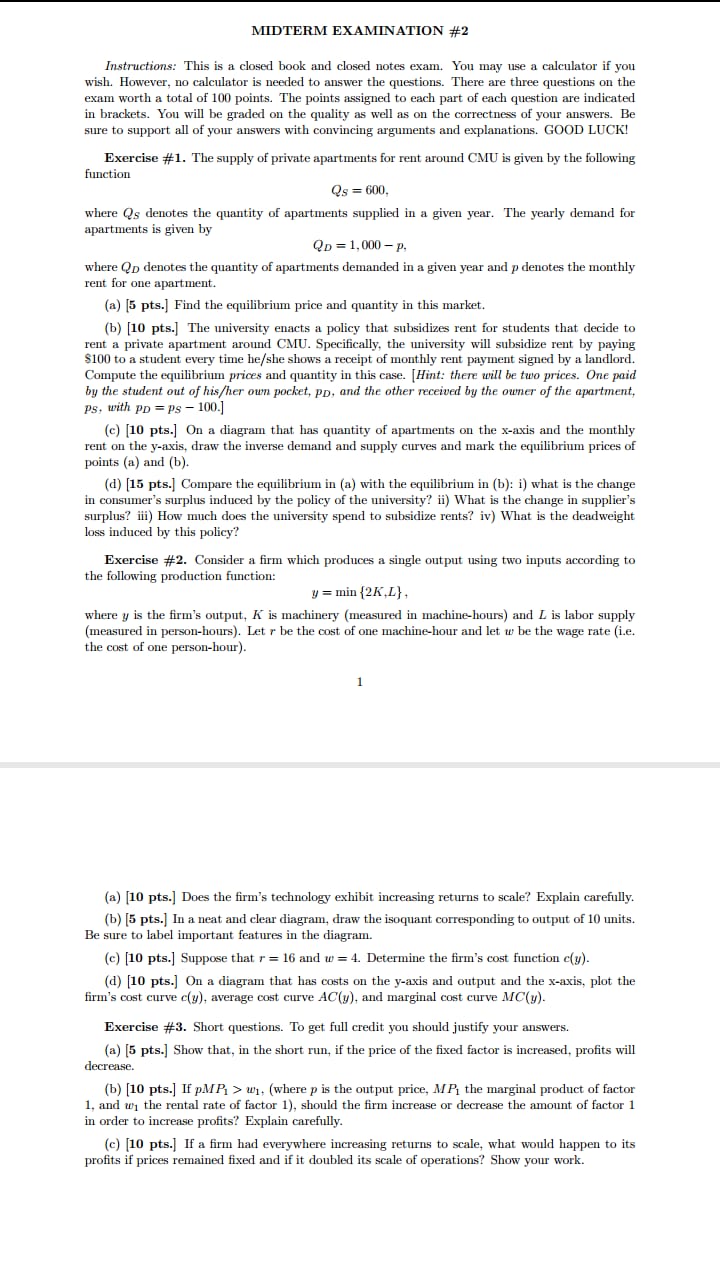
Part III. Solow Model of Growth Suppose that the production function is given by Y=0.5 VK VN. Assume that the size of the population, the participation rate, and the unemployment rate are all constant. 1. Is this production function characterized by constant returns to scale? Explain. 2. Transform the production function into a relationship between output per worker and capital per worker. 3. Derive the steady state level of capital per worker in terms of the saving rate (s) and the depreciation rate (o ). 4. Derive the equations for steady-state output per worker and steady-state consumption per worker in terms of s and o 5. Let 5 =0.08 and s = 0.16. Calculate the steady-state output per worker, capital per worker, and consumption per worker. 5. Let 6 =0.08 and s = 0.32. Calculate the steady-state output per worker, capital per worker, and consumption per worker. 7. What is the effect of an increase in the saving rate on output per worker over time? Show the transition from so to s, graphically. 8. Explain what happens to the level of output per worker and the growth of output per worker when the saving rate increases from So to $1.Part I. True/False/Uncertain Justify your answer with a short argument. 1. In an economy with technological progress, the saving rate is irrelevant in the long-run. 2. The rate of technological progress declined in the mid-1970s due to the rise of the service sector. 3. There is much theoretical and empirical support for the idea that faster productivity growth leads to higher unemployment. 4. Increased globalization and technological progress can both be blamed, at least to some extent, for the increase in wage inequality in the United States. 5. The Fisher hypothesis states that, in the short-run, the nominal interest rate increases one for one with inflation, while the real interest rate remains unchanged. Part II. The Solow Model Revisited The Republic of Solowakia has the following production function: Y = F(K,N) = AK"'N'- , where axl. Let ga be the growth rate of A, gy be the growth rate of N, and o be the rate of depreciation in this economy. 1. Interpret the parameter A. Empirically, what has happened to A over time? 2. Verify that the above production function has the property of constant returns to scale. 3. Verify that the above production function is concave in capital (which means that the second derivative is negative). What does that mean in economics terms? 4. What is effective labor in this economy? 5. At what rate do output and capital grow in Solowakia in the long run? (Hint: use g, for the transformed gA-) 6. Rewrite the production function in terms of only capital per effective worker. 7. Draw the diagram that plots required investment and investment for this economy. Label the steady-state level of capital per effective worker k,*. Label the steady state as point A on the diagram. 8. Suppose the rate of population growths falls. Use a diagram to analyze what happens in Solowakia. Label the new steady state capital per effective worker k,*. Label the new steady state as point B. 9. Starting at the steady state in part 7 (point A), suppose the saving rate increases and the depreciation rate decreases at the same time. Use a diagram to analyze what happens in Solowakia. Label the new steady state capital per effective worker ka*. Label the new steady state as point C. 10. Starting at the steady state in part 7 (point A), suppose a neighboring country gives Solowakia a gift of new capital equipment. Use a diagram to analyze what happens in the long run. Label the new steady state capital per effective worker k,*. Label the new steady state as point D.MIDTERM EXAMINATION #2 Instructions: This is a closed book and closed notes exam. You may use a calculator if you wish. However, no calculator is needed to answer the questions. There are three questions on the exam worth a total of 100 points. The points assigned to each part of each question are indicated in brackets. You will be graded on the quality as well as on the correctness of your answers. Be sure to support all of your answers with convincing arguments and explanations. GOOD LUCK! Exercise #1. The supply of private apartments for rent around CMU is given by the following function Qs = 600, where Qs denotes the quantity of apartments supplied in a given year. The yearly demand for apartments is given by QD = 1, 000 - P. where Qp denotes the quantity of apartments demanded in a given year and p denotes the monthly rent for one apartment. (a) [5 pts.] Find the equilibrium price and quantity in this market. (b) [10 pts.] The university enacts a policy that subsidizes rent for students that decide to rent a private apartment around CMU. Specifically, the university will subsidize rent by paying $100 to a student every time he/she shows a receipt of monthly rent payment signed by a landlord. Compute the equilibrium prices and quantity in this case. [Hint: there will be two prices. One paid by the student out of his/her own pocket, pp, and the other received by the owner of the apartment, ps, with PD = ps - 100.] (c) [10 pts.] On a diagram that has quantity of apartments on the x-axis and the monthly rent on the y-axis, draw the inverse demand and supply curves and mark the equilibrium prices of points (a) and (b). (d) [15 pts.] Compare the equilibrium in (a) with the equilibrium in (b): i) what is the change in consumer's surplus induced by the policy of the university? ii) What is the change in supplier's surplus? iii) How much does the university spend to subsidize rents? iv) What is the deadweight loss induced by this policy? Exercise #2. Consider a firm which produces a single output using two inputs according to the following production function: y = min {2K,L}, where y is the firm's output, K is machinery (measured in machine-hours) and L is labor supply (measured in person-hours). Let r be the cost of one machine-hour and let w be the wage rate (i.e. the cost of one person-hour). (a) [10 pts.] Does the firm's technology exhibit increasing returns to scale? Explain carefully. (b) [5 pts.] In a neat and clear diagram, draw the isoquant corresponding to output of 10 units. Be sure to label important features in the diagram. (c) [10 pts.] Suppose that r = 16 and w = 4. Determine the firm's cost function c(y). (d) [10 pts.] On a diagram that has costs on the y-axis and output and the x-axis, plot the firm's cost curve c(y), average cost curve AC(y), and marginal cost curve MC(y). Exercise #3. Short questions. To get full credit you should justify your answers. (a) [5 pts.] Show that, in the short run, if the price of the fixed factor is increased, profits will decrease. (b) [10 pts.] If pMP > w1, (where p is the output price, MP, the marginal product of factor 1, and w the rental rate of factor 1), should the firm increase or decrease the amount of factor 1 in order to increase profits? Explain carefully. (c) [10 pts.] If a firm had everywhere increasing returns to scale, what would happen to its profits if prices remained fixed and if it doubled its scale of operations? Show your work
Step by Step Solution
There are 3 Steps involved in it
Step: 1
Get Instant Access to Expert-Tailored Solutions
See step-by-step solutions with expert insights and AI powered tools for academic success
Step: 2
Step: 3
Ace Your Homework with AI
Get the answers you need in no time with our AI-driven, step-by-step assistance